warehouse management kpis, makeitalia

Warehouse Management KPIs: Which Ones to Monitor

Monitoring warehouse KPIs does not mean filling a dashboard with numbers. It means choosing a few reliable indicators, interpreting them methodically, and linking them to operational decisions: where to intervene, which process to correct, which priority to assign, and which inefficiencies are impacting service, stock, productivity, or costs.

In many companies, the warehouse already produces a significant amount of data: movements, orders, stock levels, fulfillment times, adjustments, errors, saturation, operator productivity, and service levels. The problem is not always a lack of information, but the difficulty in distinguishing which KPIs are truly needed to manage the process. If indicators are too numerous, unreliable, or disconnected from operational responsibilities, the dashboard risks becoming a descriptive report, useful for capturing the situation, but weak in guiding decisions.

An effective set of warehouse management KPIs must, instead, help answer concrete questions: Does the warehouse fulfill orders within expected times? Are stock levels reliable? Is space used consistently with flows? Does picking generate errors or slowdowns? Are logistics costs proportionate to the required service level? Are performance improving, or are the same problems recurring over time?

Why Warehouse KPIs Must Drive Operational Decisions

A KPI has value when it enables a choice. Measuring productivity, stock turnover, or inventory accuracy without linking this data to an action risks producing only partial awareness. The logistics manager or warehouse manager doesn’t just need to know that an indicator has worsened: they need to understand why it worsened, where the inefficiency originated, and what intervention can reduce the problem.

For this reason, before building a dashboard, it is useful to start with the decisions to be made. If the goal is to improve the service level, the indicators should measure timeliness, completeness, fulfillment times, and errors. If the goal is to reduce operational inefficiencies, productivity, internal lead time, rework, and backlog will be more relevant. If the problem concerns stock, KPIs on turnover, coverage, obsolescence, inventory accuracy, and saturation will be needed.

The point is not to choose an indicator because it is available, but because it helps interpret a priority. A well-chosen KPI clarifies the link between performance and operational cause. A poorly chosen KPI, however, can lead to superficial decisions, for example, intervening on picking speed when the real problem is location accuracy, or reducing stock without having checked the quality of inventory data.

The Risk of Measuring Too Much Without Understanding Where to Intervene

An overly broad dashboard can give the impression of control, but often generates the opposite effect. When every activity is measured with many indicators, the team risks focusing on the numbers easiest to update or most visible, not necessarily on the most useful ones. The dashboard becomes a collection of parallel data, without a decision-making hierarchy.

The risk increases when indicators are not read with the right frequency. Some KPIs make sense on a daily basis because they serve to manage immediate operational priorities. Others should be observed weekly or monthly because they indicate trends, capacity, costs, or structural problems. Reading everything every day can produce noise. Reading an operational indicator too late can prevent timely intervention.

The selection of KPIs must, therefore, combine three elements: data reliability, reading frequency, and linked decision. If one of these elements is missing, the indicator loses its managerial effectiveness.

To avoid ambiguous interpretations, each KPI should be clearly defined, indicating the calculation formula, data source, update frequency, monitoring responsibility, and the decision to be activated in case of deviation.

From Descriptive Indicator to Decision-Making Lever

A descriptive indicator tells what is happening. A decision-making lever helps decide what to do. The difference lies in the interpretation.

The average order fulfillment time, for example, is only useful if read in conjunction with the order type, workload, stock availability, area saturation, and activity productivity. A worsening can depend on a poorly fluid layout, unplanned peaks, location errors, low material availability, or unclear operational priorities. The same KPI, therefore, can indicate different problems.

For this reason, it is useful to distinguish between outcome KPIs and cause KPIs. The former measure the outcome of the process, such as timeliness, completeness, and service level. The latter help identify the causes of deviations, such as errors, rework, search times, or inefficiencies in movements.

Warehouse KPIs should be organized by decision families: operational efficiency, data accuracy, stock and space, service level, logistics cost. This structure helps avoid isolated readings and allows for building a more useful dashboard for those who need to intervene.

Operational Efficiency and Warehouse Productivity KPIs

Operational efficiency KPIs measure the warehouse’s ability to perform daily activities with times, resources, and flows consistent with the volumes to be managed. These are important indicators because they show where the process slows down, which activities absorb the most time, and which conditions reduce productivity.

Warehouse productivity can be interpreted in different ways: lines picked per hour, packages moved per operator, orders fulfilled per shift, units loaded or unloaded in a time window, activities completed versus planned. None of this data, alone, describes the entire efficiency of the warehouse. The choice depends on the type of flow, order structure, automation level, layout, and business priorities.

Furthermore, it is important to precisely define the unit of measurement and the scope of detection. Indicators based on lines, packages, orders, or pieces describe different workloads and, therefore, are not always directly comparable.

A common mistake is to use productivity as an absolute indicator, without considering the complexity of the activity. Picking a few orders with many lines, dispersed items, and specific controls is not equivalent to fulfilling many standardized orders. For this reason, productivity must be interpreted together with mix, volumes, errors, and throughput times.

Activity Productivity and Order Fulfillment Time

The order fulfillment time measures the time between receiving a request and completing the preparation or shipping activity, depending on the defined scope. It is a particularly useful KPI because it links the warehouse to service: if the time increases, delays, backlog, and pressure on downstream functions can grow.

Productivity, on the other hand, helps understand how much work is completed relative to the resources employed. It can be calculated per employee, shift, area, or activity. However, high productivity does not always coincide with a healthy process. If the number of lines picked increases but errors, adjustments, or rework also grow, the improvement is only apparent. Efficiency must always be read together with quality.

The decision enabled by these KPIs concerns work organization: shifts, priorities, activity balancing, operational layout review, peak management, and resource allocation. If the data highlights recurring slowdowns in a specific phase, the manager can intervene on the process, instead of merely increasing capacity.

Picking KPIs and Internal Lead Time

Picking is often one of the most sensitive warehouse activities because it affects times, errors, service, and costs. The most useful KPIs do not only concern how many lines are picked, but also with what accuracy and with what impact on the overall flow.

A picking KPI can measure lines picked per hour, picking errors, orders completed without anomalies, average time per mission, or percentage of rework. Internal lead time, on the other hand, observes the time required to pass through one or more warehouse phases: receiving, checking, storage, picking, consolidation, packing, and shipping.

When these indicators worsen, the cause can be found in unoptimized locations, outdated information, excessively long routes, unavailable stock, unclear priorities, or unbalanced workloads. The KPI should not, therefore, stop at measuring speed. It must help understand where the process loses fluidity.

Inventory Accuracy and Data Quality KPIs

Inventory accuracy is one of the most important KPIs for warehouse management because it measures the consistency between physical stock and recorded stock in the system. If inventory data is unreliable, many upstream and downstream decisions become fragile: planning, procurement, production, order fulfillment, service level, and inventory management.

A warehouse may seem operationally efficient, but it could generate significant problems if the data is incorrect. A material present in the system but not physically available can cause delays, shortages, replanning, or line stoppages. A material physically available but not correctly recorded can generate unnecessary reorders, capital immobilization, or confusion in planning.

For this reason, accuracy KPIs should not be considered administrative indicators. They are operational indicators in all respects because they determine the quality of decisions.

Inventory Accuracy, Adjustments, and Recording Errors

Inventory accuracy can be calculated by comparing quantities recorded in the system with those physically detected. The value can be expressed as a percentage of correctness for items, locations, or quantities. The calculation method should be explicitly defined, as accuracy can be measured by item, location, quantity, or economic value, with results that may vary depending on the adopted criterion. Alongside this KPI, inventory adjustments, the frequency of discrepancies, the economic value of discrepancies, and the number of recording errors are useful.

Adjustments should not be read only as accounting corrections. They can indicate process problems: unrecorded movements, receiving errors, incorrect locations, unconfirmed picks, outdated scraps, inconsistently managed returns, or non-compliance with procedures. An increase in adjustments can, therefore, signal a problem of operational discipline or data quality.

The related decision concerns the review of control points. If discrepancies are concentrated in certain material families, areas, or phases, the intervention can be targeted. If, however, the problem is widespread, it may be necessary to review procedures, training, responsibilities, and system update methods.

Why Unreliable Data Compromises Stock, Production, and Service

Unreliable data generates effects throughout the Supply Chain. If available stock does not match reality, planning can build unexecutable plans, purchasing can reorder inconsistently, production can discover shortages too late, and the customer can experience delays or incomplete deliveries.

The latent problem is that, often, inventory errors only emerge when they become operational. As long as the system shows availability, the organization tends to consider the material usable. The problem appears when someone physically searches for the item and cannot find it, or when a quantity difference blocks a shipment or production activity.

For this reason, inventory accuracy should be continuously monitored, not just during periodic inventories. Cyclic checks, analysis of recurring differences, and interpretation of adjustments help intercept problems before they impact service and operational continuity.

Stock, Turnover, and Saturation KPIs

Stock KPIs help understand whether the warehouse maintains a correct balance between material availability, occupied space, immobilization, and obsolescence risk. The issue is not having less stock in absolute terms, but having stock consistent with demand, expected service, material criticality, and operational capacity.

The turnover rate, days of coverage, saturation, and obsolescence are indicators that help interpret this balance. If observed separately, however, they can lead to partial conclusions. A low turnover can indicate immobilization, but also necessary strategic stock. High saturation can signal space inefficiency, but also temporary peaks or process constraints. A low stock level can reduce immobilized capital, but increase the risk of shortages if demand is variable or lead times are unstable.

The quality of the interpretation, therefore, depends on the ability to link stock KPIs to the operational context.

Turnover Rate and Days of Coverage

The turnover rate measures how many times stock is renewed in a given period. In general terms, a higher turnover indicates that material spends less time in the warehouse, while a low turnover can signal immobilization, excess inventory, or low movement. The formula may vary depending on the context, but the logic is to compare consumption or outflows with average stock.

Days of coverage indicate how long available stock can support projected or average consumption. It is a useful KPI because it translates stock into a more operational measure: not just how much material is present, but for how long it can cover demand.

These indicators enable decisions on analysis priorities, stock policies, parameter review, obsolete materials, risk of shortages, and the need for realignment between warehouse, planning, and purchasing. However, they must be interpreted by material class, criticality, and demand behavior. An overall average value can hide very different situations.

Warehouse Saturation and Immobilization Risk

Saturation measures how much available space is utilized. It can refer to shelving, floor areas, bays, cells, picking zones, or staging areas. A high saturation level is not necessarily negative, but it can become critical when it reduces operational fluidity, increases handling times, makes it more difficult to meet priorities, or increases the risk of errors.

When interpreting the data, it is also useful to consider the distribution of saturation among different areas of the warehouse. An overall average value can, in fact, hide localized congestion situations that slow down flows and reduce operational efficiency.

The risk of immobilization, on the other hand, concerns stock that occupies space and capital without generating operational value. It can depend on obsolete materials, unusable batches, stock not aligned with demand, technical changes, forecasting errors, or outdated reordering policies.

Reading saturation and immobilization together helps distinguish a space problem from a stock quality problem. If the warehouse is saturated because it contains slow-moving or obsolete materials, the solution is not just to find more space. It is necessary to intervene on the causes that generated the accumulation.

Service KPIs: Timeliness, Completeness, and Operational Continuity

An efficient warehouse is not just fast or productive. It is a warehouse capable of ensuring availability, timeliness, completeness, and reliability for customers, production, or internal functions. Service KPIs link logistics activities to the effects perceived by those who receive the warehouse’s output.

Among the most useful indicators are fulfillment timeliness, complete orders, service level, errors impacting internal or external customers, adherence to priorities, and the ability to manage urgencies without compromising ordinary flow. These KPIs help avoid an overly internal interpretation of performance. A warehouse may appear productive but not be effective if it fulfills many activities while leaving more critical ones behind.

Service must, therefore, be measured against operational expectations. For a warehouse serving production, line continuity may be a priority. For a distribution warehouse, timeliness and completeness of shipments may weigh more heavily. For a spare parts context, responsiveness to urgencies can be decisive.

Service Level and Adherence to Priorities

The service level measures the warehouse’s ability to respond to demand within expected times and quantities. It can be interpreted through timeliness, completeness, material availability, or adherence to delivery commitments. The specific metric depends on the context, but the principle remains the same: understanding whether the warehouse correctly supports the process to which it is linked.

Adherence to priorities is an indicator often less formalized but very important. In the presence of urgencies, peaks, or capacity constraints, the warehouse must know which activities take precedence. If priorities are unclear, the team can work hard but still generate delays on the most critical activities.

Measuring service, therefore, means observing not only the amount of work completed but also adherence to operational priorities. This allows for intervention on planning rules, communication between functions, and exception management.

Complete Orders, Errors, and Impact on Internal or External Customers

Order completeness measures the ability to fulfill a request without shortages, errors, or subsequent additions. It is a relevant KPI because it links stock, accuracy, picking, and service. An incomplete order can arise from incorrect availability, picking errors, incorrectly located materials, or unmanaged priorities.

Errors that reach the internal or external customer have a greater impact than those intercepted before leaving the warehouse. For this reason, it is useful to distinguish between errors detected during inspection, errors corrected with rework, and errors that generate service disruptions. This distinction helps understand whether controls are working or if the process is transferring problems downstream.

A good dashboard should highlight not only how many errors occur but where they originate and what impact they produce.

Warehouse Logistics Cost KPIs

Cost KPIs link warehouse management to the economic sustainability of the process. Logistics costs can include personnel, space, movements, equipment, rework, errors, packaging materials, urgency management costs, and operational inefficiencies. However, cost should never be read in isolation.

A low cost may seem positive, but if it is achieved by reducing controls, excessively saturating resources, or increasing errors and delays, it can generate higher impacts in other areas. Similarly, a higher cost may be justified if it supports a critical service level or greater operational reliability.

Logistics cost must, therefore, be interpreted together with productivity, quality, service, and flow complexity. Only then does it become a useful indicator for deciding where to intervene.

How to Interpret Costs Alongside Productivity, Errors, and Rework

A warehouse with seemingly good productivity can hide costs related to rework, corrections, additional controls, or urgencies. If an order is prepared quickly but needs to be corrected before shipment, the actual time absorbed by the process is greater than that measured in the first phase. If an error generates a return, a new shipment, or an internal stoppage, the operational cost multiplies.

For this reason, it is useful to read costs together with quality indicators. Picking errors, inventory adjustments, incomplete orders, material search times, and rework can explain why logistics costs increase even when productivity seems stable.

The related decision concerns process improvement: intervening on points that generate hidden costs, not just on the most visible items.

When a Low Cost Can Hide Operational Inefficiencies

A low logistics cost is not always synonymous with efficiency. It can indicate undersized resources, insufficient controls, postponed maintenance, limited training, or a lack of data oversight. The problem emerges when the warehouse can no longer sustain peaks, urgencies, or demand variations.

If cost is evaluated without considering service and quality, the risk is making decisions that reduce spending in the short term but increase inefficiencies, errors, and instability. A balanced dashboard must, therefore, show the relationship between cost and performance, not just the absolute value of the cost.

The correct question is not “how much does the warehouse cost?”, but “is the cost consistent with the service level, operational complexity, and required quality?”.

How to Build a Useful KPI Dashboard for the Warehouse

A useful KPI dashboard should not contain all possible indicators. It should contain those that allow for interpreting key performances and making continuous decisions. The structure can start with a few families: operational efficiency, inventory accuracy, stock and space, service, logistics cost. For each family, it is useful to select one or a few indicators, define the data source, establish the update frequency, and assign responsibility.

A minimal dashboard example might include order fulfillment time, picking productivity, inventory accuracy, adjustments, turnover rate, days of coverage, saturation, complete orders, fulfillment timeliness, and logistics cost per unit handled. The final choice depends on the context, but the criterion remains the same: each KPI must explain something and enable a decision.

To prevent the dashboard from becoming static, it is useful to review it periodically. Some KPIs can be introduced during a diagnostic phase and then reduced when the problem is under control. Others may become more important in the presence of changes in volumes, layout, product mix, or required service level.

Daily, Weekly, and Monthly KPIs: Which to Read and When

Not all KPIs need to be read with the same frequency. Daily indicators serve to manage operations: orders to be fulfilled, backlog, urgencies, daily errors, activity productivity, and immediate anomalies. Weekly indicators help interpret short-term trends, load balancing, picking performance, timeliness, completeness, and main causes of inefficiency. Monthly indicators are more suitable for evaluating turnover, saturation, logistics cost, obsolescence, overall performance, and structural improvements.

This distinction helps avoid two errors: reacting daily to indicators that require a trend analysis, or discovering an operational problem too late that would have required immediate intervention.

The reading frequency must be consistent with the decision cycle. A daily KPI must lead to a daily decision. A monthly KPI must help review processes, parameters, or priorities.

How to Link Each KPI to a Responsible Party and a Decision

Each KPI should have an owner. Without clear responsibility, indicators are observed but not managed. The owner is not necessarily the only person involved in the solution, but is the role that oversees the data, verifies its quality, interprets deviations, and initiates discussion with relevant functions.

It is equally important to link each KPI to a decision. If inventory accuracy falls below a threshold, what control is activated? If fulfillment time increases, who analyzes the cause? If saturation grows, do we intervene on space, stock, or flows? If picking errors increase, do we review locations, procedures, training, or controls?

These questions transform the dashboard from a reporting tool into a management system.

Building a More Robust Measurement of Warehouse Performance

Better warehouse measurement does not mean complicating control. It means clarifying the link between performance, causes, and decisions. A good set of KPIs allows understanding whether inefficiencies arise from processes, data, layout, stock, resources, priorities, or operational rules. This clarity reduces the risk of intervening on symptoms and helps build more solid priorities.

For many companies, the first useful step is not to add new indicators, but to evaluate those already available: which are reliable, which are continuously updated, which are truly used in decisions, and which remain confined to reporting. From this analysis, a more essential, but more effective, dashboard can emerge.

Makeitalia supports companies in analyzing logistics processes and building measurement systems consistent with operational needs. A logistics check-up can help identify priority KPIs, verify data quality, interpret warehouse inefficiencies, and define targeted interventions on processes, stock, layout, productivity, and service level. If you would like to tell us about your needs, you can contact us here.

The Role of a Logistics Check-up in Choosing Priority KPIs

A logistics check-up allows linking measurement to the operational reality of the warehouse. It does not start from a standard list of KPIs, but observes flows, activities, available data, recurring criticalities, responsibilities, and service objectives. This approach helps understand which indicators are truly useful and which risk burdening interpretation without improving decisions.

The value of the check-up also lies in its ability to distinguish causes. A service problem can depend on unreliable stock, slow picking, unclear priorities, saturation, recording errors, or unbalanced loads. Without an integrated interpretation, the risk is to intervene on a single indicator without solving the underlying problem.

An effective KPI dashboard, therefore, arises from process observation, not just data availability.

FAQ

What are the Main KPIs for Warehouse Management?

The main KPIs for warehouse management concern operational efficiency, productivity, inventory accuracy, stock, saturation, service level, and logistics cost. Among the most useful indicators are order fulfillment time, picking productivity, picking errors, inventory accuracy, adjustments, turnover rate, days of coverage, warehouse saturation, fulfillment timeliness, complete orders, and logistics cost per unit handled. The choice depends on the context and the decisions the dashboard needs to support.

How is Warehouse Efficiency Measured?

Warehouse efficiency is measured by observing times, productivity, quality, and flow continuity. Indicators such as order fulfillment time, internal lead time, activity productivity, backlog, errors, rework, and timeliness help understand if the warehouse operates smoothly. Productivity alone is not enough: a fast but error-prone process can generate higher costs and service disruptions.

What is Inventory Accuracy?

Inventory accuracy measures the consistency between stock recorded in the system and stock physically present in the warehouse. It is a fundamental KPI because it influences planning, purchasing, production, service, and inventory management. If inventory data is unreliable, the company can make decisions about material availability, reorders, and deliveries based on incorrect information.

Which KPIs to Use for Monitoring Picking?

To monitor picking, indicators such as lines picked per hour, average picking time, picking errors, orders completed without anomalies, rework, and adherence to priorities can be used. It is useful to read these KPIs together, because high productivity loses value if the number of errors increases. Picking must be measured both in terms of speed and accuracy.

How to Choose a Few Truly Useful KPIs for the Warehouse?

To choose a few useful KPIs, one must start with the decisions to be made. Each indicator should have a reliable data source, an update frequency, a responsible party, and a linked action. An essential dashboard can cover five areas: operational efficiency, inventory accuracy, stock and saturation, service level, and logistics cost. If a KPI does not help make a decision, it is probably not a priority.

Purchasing Outsourcing - Supply Chain

Supply Chain Outsourcing: How to Manage Processes and Governance

Entrusting part of the Supply Chain processes to an external partner does not simply mean moving activities outside the company. It means building an operating model in which scope, data, responsibilities, KPIs, and decision-making methods are defined before the service starts. The transition is the most delicate moment: if managed loosely, Outsourcing risks inheriting unmapped processes, incomplete information, contradictory priorities, and unclear responsibilities.

The most frequent question is not just whether it is worth outsourcing, but how to do it without losing control. Control, in this context, does not coincide with the direct management of every activity. It coincides with the ability to know what is being managed by the partner, which decisions remain internal, what data feeds the service, how performance is measured, and when operational escalations are triggered.

An effective transition to an external Supply Chain service therefore requires a clear roadmap. First, the starting point is assessed, then the scope is delimited, data and processes are prepared, the handover is managed, the service is started in a controlled manner, and, finally, governance is stabilized. It is this path that transforms Outsourcing from a delegation perceived as risky into a manageable model.

Switching to Supply Chain Outsourcing Does Not Mean Losing Control

When a company evaluates entrusting certain Supply Chain activities to an external partner, one of the first questions that emerges is almost always the same: “How much control will we lose?”. It is a understandable concern: processes such as planning, procurement, supplier management, logistics, or operational priority control directly impact production continuity, customer service, and costs. Entrusting these activities externally without a governance model can therefore seem, at first glance, like giving up a part of internal control. In reality, Outsourcing and control are not necessarily alternatives.

The point, however, is not to choose between internal control and external entrustment. The real issue is designing a system in which the partner manages defined activities, while the company maintains visibility, direction, and decision-making capacity on critical points. An external service works when it does not replace internal governance, but makes it more explicit: clear roles, shared information, escalation rules, and readable indicators allow for the process to be overseen even when daily operations are entrusted to a partner.

Why the Issue Is Not Just Delegating Operational Activities

Many transitions to Outsourcing are set up starting from the list of activities to be transferred. It is a necessary step, but not sufficient. If one limits themselves to saying what the partner must do, without clarifying how the process connects to internal functions, who decides in case of an exception, and what data must be updated, the risk is moving the same existing inefficiencies outside the company.

Delegating operational activities therefore requires preliminary work on the process. A report to be updated, a supplier confirmation to be chased, a plan to be verified, or a logistical priority to be managed are not isolated actions. They are parts of a flow involving systems, people, data, and decisions. If the flow is not understood, Outsourcing may only apparently reduce the internal load, subsequently generating requests for clarification, rework, and continuous informal handovers.

What Must Remain Governed by the Company

Even when a significant part of operations is outsourced, certain responsibilities should remain clearly overseen internally.

These include, for example:

  • strategic and business priorities;
  • decisions regarding critical materials, suppliers, or customers;
  • management of high-impact exceptions;
  • approval rules;
  • performance objectives;
  • service level evaluation;
  • decisions involving significant economic or operational impacts.

The partner must, instead, have a sufficiently clear scope to be able to act autonomously on the activities within their competence.

This balance is fundamental.

If the scope is too narrow, the partner will be forced to ask for continuous authorizations, effectively reducing the benefit of Outsourcing.

If, conversely, the scope is too broad and intervention thresholds are not defined, the company risks losing visibility on the most relevant decisions.

Defining the Service Scope Before the Handover

The scope is the foundation of the transition. Before starting the handover, the company must clarify which processes pass to the partner, which remain internal, and which require shared management. Without this distinction, every exception can become a discussion about who should intervene and every unforeseen activity can turn into operational friction.

Defining the scope does not mean making the service rigid. It means creating a common base. In an initial phase, it can be useful to start from a limited scope: a category of processes, a family of materials, a logistical flow, a part of planning, or an operational control activity. A start that is too broad, especially if data is not mature or processes are not documented, increases the risk of discontinuity.

Which Processes to Entrust to the External Partner and Which to Keep Internally

The choice of processes to entrust to the partner should be based on operational criteria, not just on the saturation of the internal team. Good candidates are recurring, measurable, documentable processes linked to fairly stable rules. These can include monitoring activities, data updates, progress control, information flow management, recurring follow-ups, operational reporting, or planning support, when the decision-making level is correctly defined.

On the other hand, highly unstable processes, lacking internal ownership, based on inconsistent data, or characterized by continuous exceptions should be evaluated with greater caution. In these cases, before entrusting the service externally, it may be necessary to map the process, clean the information, define rules, and clarify roles. Outsourcing should not become a way to avoid an unresolved organizational problem.

How to Distinguish Operational Activities, Shared Decisions, and Escalations

A well-constructed transition distinguishes three levels. The first concerns operational activities that the partner can manage autonomously, according to defined rules. The second concerns shared decisions, where the partner prepares information, analysis, or proposals and the company maintains decision-making power. The third concerns escalations, i.e., cases where an anomaly, an urgency, or a potential impact requires the involvement of specific roles.

This distinction allows for the avoidance of two extremes: on one hand, the partner blocked on every micro-decision; on the other, the partner forced to decide without a clear mandate. The service becomes more fluid when the rules are known before the start and are updated in a structured way during the stabilization phase.

A useful tool is the RACI matrix, which allows for clarifying for each activity who is:

  • R – Responsible. Who performs the activity;
  • A – Accountable. Who has final responsibility and makes the decision;
  • C – Consulted. Who must be involved;
  • I – Informed. Who must be informed.

In this way, for example, the partner can be responsible for monitoring orders and chasing suppliers, while the company maintains decision-making responsibility for critical issues that can have a significant impact on production.

This distinction protects both parties: the company avoids losing visibility on sensitive processes, while the partner works with a clear scope and can operate with greater autonomy.

Preparing Data and Processes Before the Transition

Data is one of the most critical factors in the transition to an external Supply Chain service. A partner can effectively manage a process only if they have consistent, updated, and interpretable information. If, instead, they receive incomplete master data, unverified lead times, unstated priorities, or reports built manually without shared logic, the service already starts with a high level of risk.

Preparing data does not mean making it perfect. It means knowing which information is reliable, which requires correction, and which limits must be overseen during the start-up. Transparency about weak areas is more useful than an apparently orderly snapshot that does not adhere to operational reality.

What Information Is Needed to Start an External Supply Chain Service

The necessary information depends on the scope, but certain categories often recur. Master data on materials, suppliers, customers, or plants involved is needed, along with operational data on orders, stock, lead times, backlog, deliveries and plans, priority rules, meeting calendars and cut-offs, internal references, exception management methods, KPIs, and reports already in use. To this information are added procedures, operational instructions, and decision-making criteria that often exist in practice but are not formalized.

The preparation phase is also an opportunity to distinguish what the partner needs to know from what they must be able to modify. Not all data requires the same level of access. Defining permissions, update responsibilities, and validation methods helps protect information quality and avoid overlaps between the internal team and the outsourcer.

Why Incomplete Data and Unmapped Processes Increase Risk

Incomplete data and unmapped processes make the transition more fragile because they increase dependence on people and informal knowledge. If an activity works only because a planner, a buyer, or a logistics manager knows unrecorded exceptions, shortcuts, and priorities, the external partner will need continuous confirmations. The service becomes slower and the internal team risks not truly freeing up operational capacity.

Mapping must not be bureaucratic. It must reconstruct the essential steps: inputs, outputs, systems used, activity frequency, roles involved, control points, recurring exceptions, and required decisions. In this way, the handover is not limited to the transfer of files or procedures, but becomes an orderly transfer of operational knowledge.

How to Manage the Handover to the External Partner

The handover is the phase where the designed model is put to the test. It should not be concentrated in a few final meetings but built progressively. The partner must understand the real process, shadow the people who manage it, observe exceptions, verify data, and validate rules before fully taking over the service.

An orderly transition reduces the risk of interruptions because it does not abruptly separate the before and after. The goal is to accompany the transition until activities can be managed with sufficient autonomy, responsibilities are understood, and the first KPIs confirm that the service is under control.

Assessment, Mapping, and Operational Shadowing

The path can start from an initial Assessment, useful for capturing processes, data, critical issues, and maturity levels. From here, we move to operational mapping, which clarifies how the process works today and which points must be stabilized before the transfer. Shadowing then allows the partner to see the process in action and to intercept details that rarely emerge from a written procedure.

During this phase, it is important to collect questions, anomalies, and recurring cases. The partner’s questions often reveal gray areas that the organization has managed by habit, without formalizing them. Making these areas explicit before the start allows for the reduction of errors and misunderstandings.

Pilot Phase and Controlled Service Start-up

When the scope allows, a pilot phase helps verify the model on a limited scope. The pilot can concern a process, a function, a family of materials, or a part of the information flow. Its utility lies not only in testing execution but in measuring the quality of the transition: data completeness, clarity of responsibilities, response times, exception management, and the level of collaboration between the internal team and the partner.

The controlled start-up should include a period of close monitoring. In this phase, more frequent meetings, simplified reports, and clear escalation channels help to quickly correct any deviations. Only after stabilization is it appropriate to move to ordinary governance.

KPIs, SLAs, and Responsibilities for Governing Supply Chain Outsourcing

KPIs and SLAs are essential tools for maintaining control and visibility over the service. They should not be understood as a formal post-hoc control mechanism, but as a shared language between the company and the partner. Well-chosen indicators help to understand if the service is ensuring continuity, information quality, punctuality, and the ability to respond to exceptions.

The choice of indicators must reflect the entrusted scope. If the partner manages monitoring activities, accuracy, timeliness, and completeness of updates will be relevant. If they support planning or procurement processes, backlog, meeting deadlines, quality of alerts, priority management, and escalation times may carry weight. If they oversee logistical flows, punctuality, anomalies, pick-up times, and reporting quality can be monitored.

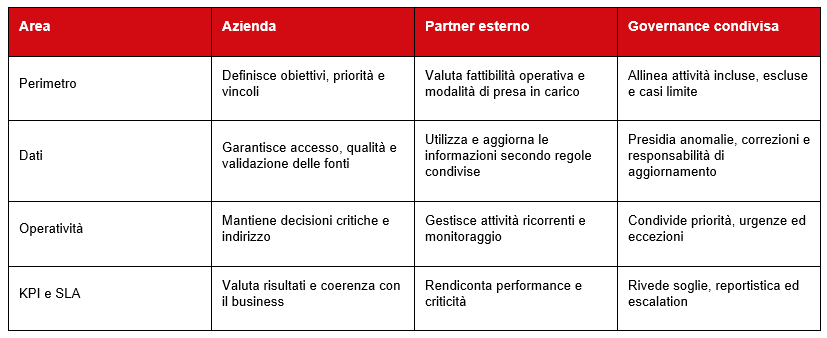
Example of Responsibility Allocation in the Transition

supply chain outsourcing, responsibility allocation

Useful Indicators for Measuring Continuity, Quality, and Service Level

A good set of KPIs should not be too broad. Better to have a few indicators truly linked to the service than an extensive list of metrics that are difficult to interpret. Continuity can be measured through compliance with planned activities and the ability to manage peaks. Quality can be observed through errors, rework, data completeness, and consistency of updates. The service level can be evaluated with response times, SLA compliance, reporting punctuality, and escalation management.

It is useful to define an initial baseline, even when not all data is perfect. Knowing how the process worked before the transition allows for evaluating whether the external service is improving, stabilizing, or simply absorbing existing operations. Without a comparison, judgment remains subjective.

How to Set Up Reporting, Meetings, and Escalations

Reporting must be consistent with the decisions to be made. A daily operational report can serve to manage anomalies and immediate priorities; a weekly meeting can help read trends, backlogs, and recurring critical issues; a monthly comparison can serve to evaluate KPIs, SLAs, improvement opportunities, and scope variations. Frequency should not be defined by habit, but based on the criticality of the service.

Escalations must be simple to trigger and clear to interpret. Each level should indicate the type of problem, the maximum time for taking charge, the functions involved, and the expected decision. In this way, urgencies and exceptions do not depend on personal relationships or informal channels, but on a shared model.

Stabilizing the Model After the Start-up

The transition does not end with the go-live. After the start-up, the model must be observed, corrected, and stabilized. It is normal for adjustments to emerge regarding scope, data, operational rules, meeting frequency, or responsibilities. This does not indicate a project failure, but the need to adapt the service to operational reality.

The stabilization phase is decisive because it consolidates trust between the company and the partner. If critical issues are addressed transparently, the service becomes progressively more fluid. If, instead, they are managed as isolated exceptions or generically attributed to the partner, the risk is creating tension and returning to informal control methods.

How to Avoid Friction Between the Internal Team and the External Partner

Friction often arises when the internal team perceives the partner as a loss of control or when the partner receives inconsistent instructions from different functions. To avoid this, it is useful to communicate clearly why the service is being introduced, which activities are changing, which responsibilities remain internal, and what operational benefits are expected.

Collaboration improves when people see that the partner does not replace internal oversight but absorbs defined activities, brings method, and makes priorities and critical issues more visible. Training also plays an important role: it serves not only to explain procedures but to build a common language on processes, data, KPIs, and escalations.

When to Review Scope, Operational Rules, and KPIs

Scope, rules, and KPIs should not be considered immutable. After the first few months of service, some activities may require more detail, others may be simplified, and some thresholds may turn out to be too sensitive or not selective enough. Periodic review allows for keeping the model aligned with business needs.

Reviewing the service does not mean renegotiating it continuously, but governing it. A mature model includes moments dedicated to improvement, where the company and partner analyze results, recurring critical issues, and possible evolutions. This prevents Outsourcing from remaining stuck at the initial snapshot, transforming it into a progressive operational oversight.

Building a Governed Transition to an External Service

An external Supply Chain service works when the transition is designed before the start-up. The point is not to exit operations without oversight, but to build a model in which activities, data, roles, KPIs, and responsibilities are clear. In this way, the company can reduce internal overload while maintaining visibility over processes and decision-making capacity on critical priorities.

Makeitalia supports companies in Supply Chain Outsourcing journeys, with an operational approach that integrates initial Assessment, process mapping, data preparation, scope definition, handover, KPIs, SLAs, and continuous service governance. When an organization evaluates switching to an external partner or needs to make an already started management more structured, a preliminary discussion can help identify risks, priorities, and necessary conditions for a safer and more manageable transition. Contact us here if you need to tell us about the challenge you are facing.

The Role of a Partner in Managing Processes, Data, and Responsibilities

The partner should not only come in downstream, when the service has already been defined in detail. They can contribute usefully even in the design phase, helping the company clarify which activities to transfer, what data to prepare, which responsibilities to maintain, and which indicators to use. This approach reduces the risk of improvised starts and makes the transition from internal management to an external model more natural.

The quality of Outsourcing depends on the quality of the transition. Where processes, data, and responsibilities are built with method, the service can become a tool to provide continuity, lighten the operational load, and make Supply Chain management more readable.

FAQ

How is the transition to an external Supply Chain service managed?

The transition is managed with a progressive roadmap: initial Assessment, scope definition, process mapping, data preparation, handover, possible pilot phase, controlled start-up, and continuous governance. The transition must clarify which activities pass to the partner, which decisions remain internal, which KPIs measure the service, and how urgencies and escalations are managed.

What data is needed to start Supply Chain Outsourcing?

The data depends on the service scope but generally includes master data, orders, suppliers, materials, stock, lead times, backlogs, plans, operational priorities, exception management rules, KPIs, and reports already in use. It is important to verify the quality of information before the start, because incomplete or outdated data can generate errors, rework, and loss of trust in the service.

How to avoid losing control by entrusting Supply Chain processes to a partner?

Control is maintained by defining scope, responsibilities, indicators, SLAs, reporting frequency, and escalation rules. The company does not necessarily have to manage every activity directly but must be able to read performance, decide on critical priorities, and intervene when the service requires an internal choice. Governance is what makes Outsourcing manageable.

What is the difference between Supply Chain Outsourcing and Temporary Management?

Supply Chain Outsourcing involves entrusting continuous activities or processes to an external partner, according to a defined scope and service model. Temporary Management, on the other hand, temporarily introduces a managerial figure to lead a phase of change, cover a vacant role, or manage a specific project. They are different tools and can respond to different organizational needs.

Which KPIs and SLAs should be used to govern an outsourced Supply Chain service?

Indicators must be consistent with the entrusted process. They can concern activity punctuality, response times, data accuracy, completeness of updates, errors and rework, meeting deadlines, reporting quality, escalation management, and service continuity. SLAs should define expected levels, take-charge times, and exception management methods.

supply chain risk intelligence, makeitalia

Supply Chain Risk Intelligence: How to Predict Risks Before They Impact the Business

In Supply Chain management, recognizing a risk when it has already produced a delay, shortage, or production downtime means intervening with reduced room for maneuver. Supply Chain Risk Intelligence was created to move risk oversight further upstream: it does not promise to predict every event with certainty, but it helps recognize in advance combinations of signals that increase the probability of an operational or economic impact.

This approach does not replace Supply Chain risk management, but makes it more continuous and decision-oriented. While traditional Risk Management identifies, evaluates, and mitigates risks, Risk Intelligence works on the ability to observe internal data, external signals, anomalies, and behavioral variations before they become visible criticalities. In this sense, it represents a more evolved level of oversight: it connects monitoring, leading indicators, Early Warning systems, AI, and decision-making ownership.

The point is not to generate more dashboards or more notifications. Value is created when a signal is transformed into a clear priority, assigned to a responsible function, and linked to a preventive action. Without this step, even the most advanced system risks producing operational noise rather than increasing the time available to intervene.

From Risk Management to Risk Intelligence in the Supply Chain

Many companies have already introduced Risk Management practices: they classify risks, evaluate critical suppliers, monitor logistics performance, define mitigation plans, and periodically update priorities. This oversight remains necessary, but it may not be sufficient when conditions change rapidly and when the effects of an anomaly propagate along the supply chain in a short time.

Risk Intelligence adds an operational principle: observing risk as it forms. Instead of merely capturing a snapshot of a situation at set times, the system collects continuous signals and interprets them against thresholds, correlations, and decision rules. A variation in lead time, an increase in order changes, a decline in supplier punctuality, or a growth in planning exceptions are not automatically a serious risk. However, they can become leading indicators if read together and in relation to the context.

Why Periodic Monitoring Is Not Enough When Risks Change Rapidly

Periodic monitoring works when phenomena evolve gradually. In industrial Supply Chains, however, some risks emerge through weak signals that accumulate before becoming evident. A supplier responding a few days late, a material starting to have unstable availability, a logistics route showing more variable times, or demand deviating from forecasts can seem like isolated events. If observed in sequence, they can indicate growing vulnerability.

The problem is not only the speed of change but also the fragmentation of information. Procurement, planning, logistics, operations, and management may see different parts of the same phenomenon. Without a model that links data and responsibility, the risk is understood only when the criticality has already entered the production process or service level.

The Difference Between Predicting a Risk and Recognizing Leading Signals

Predicting a risk does not mean knowing for certain what will happen. In the Supply Chain, many events depend on external variables, supplier behavior, market conditions, and logistics constraints that are not fully controllable. Risk Intelligence therefore works on probabilistic logic: it identifies conditions that increase the probability of an impact and helps the organization decide sooner.

This distinction is also important for correctly evaluating the role of AI. A predictive model can recognize patterns, anomalies, and correlations that are difficult to intercept manually, but it does not eliminate uncertainty. The quality of the system depends on the available data, interpretation rules, transparency of thresholds, and the ability of people to transform alerts into coherent decisions.

Which Signals to Observe to Anticipate Delays, Shortages, and Disruptions

An effective Supply Chain Risk Intelligence system does not start from an infinite list of possible risks, but from observable signals. A signal is a piece of information that, alone or combined with others, can indicate a deviation from expected behavior. Its usefulness depends on the ability to link it to a potential effect: delay, shortage, cost increase, service level reduction, production saturation, or flow interruption.

The most useful signals are often already present in company systems but are read separately. The value of Risk Intelligence lies in putting them in relation to one another. A single delivery delay may be an ordinary event; recurring delays on a critical material, associated with a reduction in order confirmations and a growth in lead time, may instead require preventive action.

Internal Signals: Orders, Lead Time, Stock, Planning, and Operational Performance

Internal data offers an essential foundation because it describes the actual behavior of the Supply Chain. Open orders, confirmed dates, delivery changes, actual lead times, stock levels, coverage, backlog, supplier performance, variances between plan and actual, and the frequency of operational exceptions are valuable sources for building leading indicators.

An increase in variations on confirmed dates can anticipate supplier reliability issues. A progressive reduction in coverage on a critical component can indicate growing exposure to shortages. An increase in exceptions managed manually by planning can signal that the process is losing stability. In all these cases, the data becomes useful only if it is linked to an attention threshold and a clear responsibility.

External Signals: Suppliers, Critical Materials, Market, and Logistics Context

Alongside internal data, external signals help broaden the reading capacity. They can concern changes in material availability, tensions in certain product categories, variations in transport times, instability in specific geographic areas, regulatory changes, or qualitative information gathered from supplier relationships.

These signals must not turn the system into a generic observatory. They must be selected based on the potential impact on the business. For a strategic material, a decline in supplier punctuality and an external signal of availability tension may justify an early check of stock, sourcing alternatives, or production priorities. For a non-critical material, the same signal might only require monitoring.

How to Transform Fragmented Data into an Early Warning System

The most delicate step is not collecting data (rather, we could open a parenthesis on the level of data structuring), but transforming it into a truly usable Early Warning system. Many companies already have information on suppliers, orders, stock, transport, and operational performance. The problem arises when this information remains distributed among ERPs, Excel files, planning systems, local reports, portals, and email communications.

An Early Warning system must reduce this fragmentation and create a logical chain between data source, signal, potential risk, attention threshold, responsible function, and preventive action. If one of these steps is missing, the alert risks remaining a notification without operational consequences.

Why a Dashboard Is Not Enough Without Decision Rules

A dashboard can make a situation visible, but it does not decide what to do. If it shows dozens of indicators without priority, the interpretive work remains with people, and the risk is that each function reads the data with different criteria. In this case, technology increases transparency but not necessarily the capacity for intervention.

Decision rules serve to establish when a signal is relevant, what level of severity it assumes, who must take charge of it, and what actions are planned. A useful dashboard does not just display data: it guides the reading, highlights significant exceptions, and makes the transition from observation to decision clear.

The Link Between Data Source, Signal, Potential Risk, and Preventive Action

The link between data and actions must be explicitly designed. For example, an anomalous variation in lead time for a critical supplier can generate an alert only if it exceeds a defined threshold and if the impacted material has coverage below a certain level. The preventive action can be a check with the supplier, the activation of an alternative source, a review of production priorities, or an update of the procurement plan.

This logic allows for avoiding two extremes: ignoring important signals because they are scattered across different systems, or activating continuous escalations for anomalies that have no real impact. The quality of the Early Warning depends precisely on the ability to select what deserves attention.

How to Prioritize Alerts Without Increasing Operational Noise

One of the main risks of monitoring systems is the multiplication of alerts. If every variation generates a notification, users start to ignore the system or handle it as an additional administrative burden. Good Risk Intelligence must instead reduce noise, not increase it.

The priority of an alert should depend on multiple dimensions: probability of the event, business impact, criticality of the material or supplier, time available to intervene, availability of alternatives, and reliability of the signal. A high-priority alert is not simply a larger anomaly, but a condition that requires a timely decision because it can influence operational continuity, service, or margins.

Attention Thresholds, Severity Levels, and Decision-Making Responsibilities

Thresholds must be built with balance. Thresholds that are too sensitive generate false alarms. Thresholds that are too rigid intercept the problem when it is already advanced. For this reason, it is useful to start from a controlled scope (on critical suppliers, materials, or processes) and progressively calibrate the rules based on the evidence collected.

Every severity level should correspond to a decision-making responsibility. A first level may require monitoring and data verification. An intermediate level can activate procurement or planning. A higher level can involve operations and management to evaluate alternative scenarios. Clarity of ownership is what transforms the system from an information tool into an operational mechanism.

When to Activate Escalations, Alternative Scenarios, and Preventive Actions

Escalation should not be activated only when damage is imminent. It must serve to increase the useful time to decide. If a critical material shows signs of instability, intervening earlier can mean reviewing priorities, advancing orders, qualifying alternatives, modifying production plans, or communicating more promptly with customers and internal functions.

The quality of the decision also depends on the preparation of alternative scenarios. A mature Risk Intelligence system does not just say that a risk exists, but helps evaluate options. Which alternative supplier is available? Which production can be rescheduled? Which stock is actually usable? What economic impact is associated with each choice? Without this translation, the alert remains incomplete.

The Role of AI in Supply Chain Risk Intelligence

Artificial intelligence can make Supply Chain Risk Intelligence more effective when it is inserted into an already governed process. Its contribution is particularly useful in reading large amounts of data, recognizing historical patterns, identifying anomalies, and prioritizing signals that would be difficult to correlate manually.

However, AI should not be presented as a shortcut. If data is incomplete or unstructured, rules are not clear, or decision-making responsibilities are not defined, an advanced model can produce outputs that are difficult to interpret or poorly adopted by users. Value arises from the integration of technology, process, and Supply Chain expertise.

Where AI Can Help: Patterns, Anomalies, Correlations, and Priorities

AI can support risk monitoring by identifying behaviors outside the norm relative to the history of the supplier, material, or process. It can signal correlations between delays, order changes, decreasing stock, and demand variations. It can help classify alerts by priority, reducing the time needed to distinguish truly critical cases from physiological fluctuations.

In some contexts, predictive models can estimate the probability of delay or shortage based on historical data and updated signals. In others, simpler but well-designed systems can already produce value through structured rules, thresholds, and alerts. The choice should not depend on technological ambition, but on the problem to be managed and the maturity of the available data.

The Limits of AI: Why Probabilistic Prediction Does Not Mean Certainty

A predictive system does not eliminate unforeseen events. It can increase the ability to recognize risk conditions, but it does not guarantee that every criticality will be anticipated. This awareness avoids unrealistic expectations and helps design more reliable systems.

Transparency is a decisive element for adoption. Users must understand why an alert is generated, what data supports it, and what action is required. If the model is perceived as a black box, trust decreases and people tend to return to manual evaluations or parallel channels. For this reason, AI must support human judgment, not replace it.

How to Introduce a Risk Intelligence System Progressively

Introducing Supply Chain Risk Intelligence does not necessarily require a large project from the start. An effective path can start from a limited but relevant scope: a family of critical materials, a group of strategic suppliers, a particularly exposed planning process, or a high-variability logistics route.

The first step consists of evaluating the available data sources and their reliability. Subsequently, signals to monitor are selected, thresholds and rules are defined, alerts linked to precise responsibilities are built, and it is measured whether the system truly helps to intervene sooner. Only after this phase does it make sense to extend the model to other processes or integrate more evolved AI and automation components.

Data Source Assessment and Selection of Leading Indicators

An initial Assessment allows for understanding which data is already usable, which requires cleaning or integration, and what information is missing to build a reliable system. Not all data needs to be perfect to start, but it is necessary to know what limits exist and how they can influence alerts.

The selection of indicators must remain focused. Better to have a few signals linked to concrete decisions than a broad set of metrics that are difficult to interpret. Lead time, supplier punctuality, variations in confirmed dates, stock coverage, material criticality, and frequency of exceptions can constitute a solid initial base if linked to thresholds and responsibilities.

From Initial Thresholds to Alerts: Building a Model Adoptable by Functions

An adoptable model is understandable, calibrated, and useful in daily work. The functions involved must know when an alert requires a check, when a decision, and when an escalation. They must also be able to distinguish between an informative signal, a risk to be monitored, and a risk to be managed with immediate action.

Adoption also depends on the quality of organizational change. Procurement, planning, logistics, and operations must share reading criteria, roles, and update methods. If the system is perceived as an external control or as an additional report, its effectiveness is reduced. If, instead, it is integrated into decision-making processes, it becomes a coordination tool.

When to Involve External Expertise on Data, Processes, and Early Warning

The support of external expertise can be useful when the company recognizes the need to anticipate risks but does not have sufficient method, data governance, or integration capacity internally. In these cases, a Supply Chain Risk Intelligence Assessment can help connect processes, information sources, KPIs, thresholds, dashboards, responsibilities, and escalations.

The role of consulting should not be to propose a platform before understanding the process. The most useful contribution consists of designing a progressive path: evaluating available data, identifying priority signals, building an Early Warning model, defining responsibilities, and measuring the effectiveness of preventive decisions. Only on this basis can technology, AI, and system integration produce stable value.

FAQ

What Does Supply Chain Risk Intelligence Mean?

Supply Chain Risk Intelligence means using internal data, external signals, leading indicators, Early Warning systems, and, when useful, AI in a coordinated way to recognize conditions that can generate risks in the Supply Chain. Its goal is not to predict every event with certainty, but to increase the time available to intervene before a risk produces delays, shortages, disruptions, or economic impacts.

What Is the Difference Between Risk Management and Risk Intelligence?

Risk Management identifies, evaluates, and manages risks along the Supply Chain. Risk Intelligence adds a more continuous and predictive oversight, based on the observation of weak signals, anomalies, and data combinations that can anticipate an impact. The two approaches are complementary: Risk Intelligence makes the decisions provided for by the risk management model more timely.

What Data Is Needed to Build an Early Warning System in the Supply Chain?

Data consistent with the risk to be managed is needed. In many cases, information on orders, confirmed dates, lead times, stock, coverage, supplier performance, backlog, planning exceptions, transport, and critical materials is useful. To these, external signals can be added, provided they are selected based on their operational relevance and linked to thresholds, responsibilities, and preventive actions.

Can Artificial Intelligence Predict Supply Chain Risks?

Artificial intelligence can help estimate probabilities, recognize patterns, identify anomalies, and prioritize alerts, but it cannot guarantee a certain prediction of every risk. Its value depends on the quality of the data, the clarity of the process, and the ability of people to interpret the outputs. For this reason, AI must be introduced as a decision support, not as a replacement for human judgment.

How to Prevent Alerts from Becoming Too Numerous or Not Very Useful?

To avoid operational noise, alerts must be linked to calibrated thresholds, severity levels, and decision-making responsibilities. Every notification should indicate why the signal is relevant, what potential risk it represents, and which function must intervene. An effective system does not indiscriminately increase the information available but helps distinguish what requires immediate attention from what can be monitored.

A Concrete Path to Anticipate Risks in the Supply Chain

To introduce a Supply Chain Risk Intelligence approach, it is not enough to add new indicators or monitoring tools: it is necessary to connect data, processes, responsibilities, and decisions progressively.

Makeitalia supports companies on this path, from the analysis of information sources and existing processes to the definition of KPIs, attention thresholds, Early Warning systems, and operational escalations. When the organization needs to make risk oversight more structured, evaluate data maturity, or design a more effective monitoring model, a preliminary discussion can help identify the most suitable starting point and the priorities to act upon. Let’s talk about it together, contact us here.

Supply Chain Process Automation

Supply Chain Process Automation: Where to Start

Automating Supply Chain processes does not mean starting immediately with software, an algorithm, or an artificial intelligence project. The first step is more concrete: understanding which process, among those currently managed with manual activities, Excel files, emails, ERPs, and external portals, can generate a measurable benefit if automated.

Many companies reach this point with a seemingly simple question: where to start? The answer depends not only on the available technology but also on process maturity, data quality, stability of operating rules, and clarity of internal responsibilities. Automating a poorly governed process risks making an already fragile workflow faster without resolving the root causes of errors, delays, or rework.

An effective project therefore starts with a selective choice. Not everything needs to be automated immediately. The first process to automate should be repetitive enough to justify the intervention, critical enough to produce a visible impact, and stable enough not to require continuous manual exceptions.

Before Automating, Understand if the Process Is Ready

The starting point is not the question “what technology can we adopt?” but “what operational problem do we want to reduce?” In a complex Supply Chain, manual activities are not all the same. Some consume time because they are repetitive and standardizable, while others still require interpretation, cross-functional comparison, or decisions related to frequent exceptions.

A process is a good candidate for automation when it follows sufficiently clear rules, uses available and reliable data, repeats with significant frequency, and produces measurable effects on times, errors, backlog, or decision quality. If, however, the process changes continuously, has no defined owners, or relies on incomplete data, automation may be premature.

In these cases, before automating, it is often necessary to work on digitalization, standardization, or revision of the operational flow. Digitalizing means making data and information available in a structured way. Automating means reducing or eliminating recurring manual activities. Introducing AI, in some cases, means supporting analyses, forecasts, or decisions with more advanced models. Confusing these levels leads to projects that are too broad, difficult to adopt, and complicated to measure.

Automation, Digitalization, and AI Are Not the Same Thing

Digitalization creates the conditions for information to be collected, updated, and accessed in a more organized way. Automation intervenes in repetitive operational steps, reducing manual activities such as data entry, checks, notifications, data transfers, or updates between systems. Artificial intelligence can come into play when the process requires predictive capabilities, classifications, suggestions, or scenario analyses.

In the Supply Chain, this distinction is essential. A company may need to automate a document flow between purchasing and suppliers without introducing AI. Or it may need to improve the quality of warehouse data before automating planning activities. In other cases, AI may only be useful after rules, historical data, and KPIs have been consolidated.

The most common risk is starting at the last level, i.e., with the most visible technology, without having verified if the underlying process is ready. An automation project works when technology, process, and people move forward together.

When a Manual Process Is Not Yet Automatable

Not all manual processes are automatically ready for automation. An activity can be arduous, repetitive, and perceived as inefficient, but not necessarily mature for technological intervention.

A sign of low maturity is the continuous presence of uncodified exceptions. If each case is handled differently, if rules change based on the person involved, or if information comes from uncontrolled sources, automation risks amplifying complexity. The same happens when data is unreliable: automating a flow based on incomplete master data, outdated lead times, or inconsistent stock can generate faster decisions, but not necessarily better ones.

Before proceeding, it is therefore useful to distinguish between processes to automate immediately, processes to standardize, and processes to redesign. This distinction reduces the risk of technological investments that are not adopted by users or are unable to produce measurable benefits.

How to Map Supply Chain Processes Before Choosing the Pilot

The AS-IS mapping is the step that transforms a generic perception of inefficiency into a concrete basis for decision-making. It is not about bureaucratically documenting every detail, but about reconstructing how the process works today: who does what, with what tools, what data is used, where delays, errors, or rework occur.

In many companies, critical points emerge in the transitions between systems and functions. Data is exported from the ERP, reprocessed in Excel, sent via email, compared with a supplier portal, and then manually re-entered into another system. Each step adds time, potential for error, and dependence on individuals.

Mapping also serves to distinguish truly decision-making work from administrative or repetitive work. A planner, buyer, or logistics manager should dedicate time to managing priorities, exceptions, and critical scenarios, not to manual data transfer or repeated verification of already available information.

Where to Look for Repetitive Activities, Errors, and Low-Value Steps

The first candidates for automation are often found in activities that connect planning, purchasing, logistics, and operational control. They are not always the most obvious or “technological” processes; often, they are daily, fragmented, and underestimated steps.

This can involve the manual updating of progress reports, the collection of confirmations from suppliers, the checking of discrepancies between orders and deliveries, the generation of alerts for delays, the reconciliation of warehouse data and planning, or the preparation of operational dashboards. These are activities that, if performed manually, consume time and slow down the information cycle.

The question to ask is not just how much time a single activity requires, but how many times it is repeated, how many people it involves, and what decisions it slows down. An activity of a few minutes, if repeated many times a week by different roles, can hide a significant operational cost and a relevant impact on information quality.

The Role of Data, Operating Rules, and Ownership

An automatable process needs three basic conditions: available data, clear operating rules, and defined responsibilities. If one of these elements is missing, the project first requires preparatory work.

Data must be accessible, updated, and consistent across sources. Operating rules must be sufficiently explicit: when to generate an alert, when to block a flow, when to request validation, or when to update information. Ownership must be clear, because every automation changes how people work and make decisions.

Without ownership, even a good technical solution can remain unused. If no one governs the rules, updates parameters, interprets KPIs, or manages exceptions, automation becomes an object separate from the real process.

Which Process to Automate First: Impact and Feasibility Criteria

The choice of the first process to automate should arise from the intersection of impact and feasibility. Impact measures how much the process affects time, costs, data quality, service, or operational load. Feasibility measures how stable, standardized, integrable, and acceptable the process is for the users involved.

A high-impact but very complex process may be unsuitable for a first pilot, as it requires too many preliminary interventions. Conversely, a very simple but low-impact process may be useful as a technical test, but risks not generating sufficient internal attention. The balance point is found in processes where the benefit is visible and the complexity is manageable.

To evaluate priorities, it is useful to observe several criteria jointly: activity frequency, time absorbed, number of errors or reworks, quality of available data, clarity of operating rules, number of systems involved, impact on decisions, and user willingness to change their way of working. This approach helps avoid choices based solely on immediate pressure or technology availability.

Processes Most Suitable for a First Automation Project

A first pilot should involve a circumscribed, measurable process that users recognize as a source of inefficiency. In the Supply Chain, typical examples can be the automation of checks on operational data, the sending of notifications for delays or anomalies, the structured collection of information from suppliers, the automatic updating of dashboards, or the management of repetitive document flows.

Some planning activities can also be good candidates, provided they are well-defined. For example, an automatic check on discrepancies between demand, availability, and capacity can help the planner focus on the most relevant exceptions. The goal is not to replace the decision, but to reduce the manual work required to reach the decision.

The same applies to purchasing and logistics. Automating the collection of confirmations, reporting delays, verifying deadlines, or producing recurring reports can free up operational time and improve the timeliness of information. The benefit becomes more solid when the automated process is linked to clear and shared KPIs.

Processes to Postpone When Data and Rules Are Not Stable

Some processes should be postponed, at least as a first intervention. These are processes where rules are not shared, data is incomplete, exceptions outweigh standard cases, or the organizational impact is too broad compared to internal maturity.

Postponing does not mean giving up. It means preparing the process before automating it. In some cases, the correct work involves cleaning master data, updating parameters, defining responsibilities, reducing unnecessary variations, or clarifying decision criteria. Only after this step can automation produce a stable improvement.

This caution is particularly important in projects linked to AI & Automation. Artificial intelligence can be a powerful enabler, but it requires sufficiently robust data, objectives, and processes. Without these conditions, the risk is introducing technological complexity into a context that would first need operational order.

KPIs to Measure a Supply Chain Automation Project

An automation project must be measurable even before it is implemented. Defining KPIs retrospectively makes it difficult to distinguish a real improvement from an initial positive perception. For this reason, it is useful to establish a baseline: how the process works today, how much time it consumes, what errors it produces, how much rework it generates, and how much it affects decision speed.

KPIs can relate to efficiency, data quality, internal or external service, and user adoption. Cycle time measures how long an activity takes from start to finish. The number of errors or reworks indicates the quality of the flow. Backlog shows whether automation reduces overdue activities. Man-hours saved help understand how much operational work is freed up. Data accuracy and information lead time, on the other hand, measure how much the process produces more timely and reliable information.

However, abstract promises or undocumented numbers must be avoided. Each company starts from different conditions: systems, data, processes, skills, and volumes influence the results. The value of the pilot lies precisely in the ability to measure, within a controlled scope, what can be scaled more broadly.

Indicators Before and After the Pilot

Before the pilot, KPIs describe the starting situation. After the pilot, they allow evaluation of whether automation has reduced real friction. Measurement should cover both the operational result and the quality of the user experience.

If a flow becomes faster but requires continuous manual correction, the benefit is partial. If it reduces data update time but is not used by teams, the problem is not just technical: it concerns process design, training, or trust in the information produced.

For this reason, alongside quantitative KPIs, it is useful to observe user behavior. How many exceptions are managed outside the system? How often do users revert to using Excel as a parallel tool? How many decisions continue to depend on informal email exchanges? These signals help understand whether automation has truly integrated into the process or if it has remained an additional layer.

Why Measuring Adoption Is as Important as Measuring Efficiency

The success of an automation project does not depend solely on the flow functioning technically. It depends on the organization’s ability to use it stably. Unadopted automation creates a dual track: on one side, the new tool, on the other, old operational habits.

Measuring adoption means verifying whether people trust the new process, whether data is considered reliable, whether rules are understood, and whether exceptions are managed as intended. When these elements are not addressed, the project may appear correct on paper but produce little value in practice.

Training, therefore, plays an operational, not an accessory, role. It serves not only to explain how to use a tool but also to clarify why the process changes, what decisions are supported, and what responsibilities remain with individuals.

From Pilot Process to Scalability

The pilot should not be conceived as an isolated experiment, but as the first step in a scalable journey. For this reason, it must be circumscribed enough to be manageable, yet significant enough to generate useful learning for other processes.

After the pilot, the company should ask what it has learned about its way of working. Which data proved reliable? Which rules required corrections? Which users adopted the new flow more easily? Which integrations with existing systems proved necessary? These answers help build a more robust roadmap.

Scaling does not mean mechanically replicating the same solution in other areas. It means applying the same method: process selection, readiness verification, KPI definition, pilot design, measurement, training, and progressive extension. In this way, automation becomes an organizational capability, not a sum of disconnected initiatives.

How to Avoid Isolated or Unadopted Automations

Isolated automations often arise from local needs, resolved quickly but without a process vision. They can generate immediate benefits, but over time they risk creating new fragmentation: unintegrated tools, different logic between functions, duplicated data, and unclear responsibilities.

To avoid this, every project should be linked to an overall Supply Chain process map and data governance. Even a small intervention must be consistent with how the company wants to manage information, decisions, and operational flows.

Scalability also requires clear communication with users. If automation is perceived as a technical imposition, resistance grows. If, however, it is presented as a way to reduce repetitive activities, improve information quality, and make operational priorities more visible, adoption becomes more natural.

When to Involve Consulting, System Integration, and AI & Automation

The involvement of external expertise can be useful when the company has already identified a need but lacks the internal method, time, or skills to transform it into a structured project. A Supply Chain process assessment can help interpret the AS-IS situation, identify candidate processes, and build a priority matrix based on impact and feasibility.

Process consulting is particularly useful when the problem is not just technological but concerns operating rules, responsibilities, data, and decision-making methods. System integration becomes central when flows cross ERPs, portals, planning tools, databases, or dashboards. AI & Automation solutions, on the other hand, come into play when the process is mature enough to benefit from more advanced automations, predictive analytics, or decision support.

The point is not to add technology where there is no order, but to build the conditions for technology to produce value. A well-designed project starts with a clear scope, measures results, and prepares the organization to progressively extend automation to other processes.

FAQ

Which Supply Chain Process Is Best to Start Automating?

It is best to start with a repetitive, measurable, and high-impact operational process that still has manageable complexity. A good candidate is a flow where people currently spend a lot of time on manual activities, checks, updates, or data transfers. Furthermore, it should be a flow where sufficiently clear rules exist to define what should happen. The choice should not depend solely on perceived criticality, but on the intersection of expected benefit, data quality, process stability, and users’ willingness to adopt the new way of working.

What KPIs Should Be Used to Evaluate Supply Chain Process Automation?

The most useful KPIs depend on the process, but generally include cycle time, errors, reworks, backlog, man-hours absorbed, data accuracy, information lead time, and user adoption level. Measurement must begin before the pilot to compare the initial situation with subsequent results. It is important not to limit oneself to efficiency: the quality of information and the actual adoption of the automated process are also decisive indicators.

Is It Better to Choose Software First or Analyze Processes?

In most cases, it is preferable to analyze processes first. Software selection should come after clarifying which activities to automate, what data is needed, what rules guide the process, and what KPIs will measure the result. Choosing a tool first can lead to forcing the process into an unsuitable solution or introducing functionalities that users will not utilize. AS-IS analysis and defining the pilot’s scope reduce this risk.

Does Supply Chain Automation Always Require Artificial Intelligence?

No, Supply Chain automation does not always require artificial intelligence. Many benefits can arise from workflow automations, system integrations, operational dashboards, automatic alerts, or more structured data management. AI becomes relevant when the process requires more advanced analyses, predictive support, classifications, or decision-making suggestions. Before introducing it, it is useful to verify that data, rules, and objectives are sufficiently robust.

Concrete Support for Automation Projects

Identifying the right starting point is often the most complex part of an automation journey. For this reason, many companies choose to partner with experts who understand both the processes and the technologies that support the Supply Chain.


At Makeitalia, we support companies in process analysis, defining intervention priorities, designing pilots, and evaluating the most suitable automation solutions for the company context.

If you are considering how to automate certain processes in your Supply Chain or want to discuss a specific need, you can contact us through the Contact page: we will be happy to delve into your objectives and evaluate improvement opportunities together.

Gears with in-source and outsource labels for strategic outsourcing management

Procurement Outsourcing: When to Outsource Your Purchasing Department

In many manufacturing companies, a significant portion of the purchasing department’s time is absorbed by operational activities such as supplier reminders, order confirmations, date updates, and document management.

Often, these activities involve B and C class suppliers and materials: essential for production continuity, but with limited impact on strategic sourcing and negotiation decisions.

The critical issue is not the purchasing department’s capability, but the use of strategic skills on low value-added activities.

Procurement outsourcing is beneficial when it allows the delegation of operational, recurring, or low-strategic-value activities without reducing control over critical suppliers, costs, priorities, and operational continuity. It is not a binary choice between “all in-house” and “all external”; in most cases, it functions as a selective model, built on well-defined processes, product categories, and responsibilities.

For a purchasing manager, the issue becomes relevant when internal buyers are absorbed by orders, confirmations, reminders, document collection, management of non-critical codes, and administrative tasks. The risk is not only an increase in operational workload but, more importantly, a reduction in time available for value-generating activities: strategic sourcing, negotiation, vendor rating, supplier development, and Supply Chain criticality management.

A correct assessment therefore starts with a precise question: which activities can be delegated without losing control, and which must remain internal because they impact strategy, production continuity, core business, or competitive advantage?

What Selective Purchasing Outsourcing Means

Outsourcing purchasing means entrusting an external partner with the continuous management of a portion of purchasing processes. The scope can include operational activities, specific product categories, non-strategic materials, supplier reminders, order management, or document support.

In practice, a company can decide to keep the management of strategic suppliers, negotiations, and sourcing decisions in-house, while delegating activities such as order issuance, confirmation monitoring, supplier reminders, and document management for low-strategic-impact categories.

The central point is selectivity. An external purchasing office should not indiscriminately replace the internal function, but rather integrate with it. Critical decisions, supply strategies, and relationships with high-impact suppliers must remain under clear governance, with well-defined responsibilities.

In this sense, procurement outsourcing is not just a reduction in workload. It is an organizational model that allows internal resources to focus on higher value-added activities, while maintaining operational continuity for more repetitive processes.

To function effectively, the model requires mapped processes, defined roles, escalation rules, shared KPIs, and monitoring tools. Without these elements, delegation risks generating opacity instead of efficiency.

When Purchasing Outsourcing Can Be a Coherent Choice

Purchasing outsourcing can be coherent when the main problem is not a lack of skills or strategy, but the saturation of the internal structure with operational and repetitive activities. In these cases, keeping everything in-house may seem safer, but it ultimately reduces the time available for activities that generate greater value for the company.

The benefit should not be evaluated solely on the direct cost of the service compared to an internal resource. Operational continuity, response times, process quality, supplier oversight, ability to absorb peak workloads, and required specialization level all come into play.

Operational Overload of the Purchasing Department

A first sign is the overload of buyers with administrative or recurring activities. Orders, confirmations, reminders, document updates, and follow-ups with suppliers can absorb a significant portion of available time.

When these activities prevent senior buyers from working on negotiation, savings, supplier development, or total cost of ownership analysis, the company is using strategic skills for operational activities. In this scenario, outsourcing can free up internal capacity without altering decision-making oversight.

Continuous Management of Repetitive Activities

Outsourcing is particularly suitable when the need is continuous. If the company needs to manage supplier reminders, order confirmations, master data updates, or document collection every week, external management can bring greater regularity to the process.

Continuity is different from occasional support. A recurring activity requires standards, timelines, responsibilities, and reporting. For this reason, outsourcing works best when the process is repeatable and measurable.

Non-Strategic Categories and B and C Materials

B and C materials, indirect purchases, or low-unit-value categories can generate a high operational load relative to their economic and strategic impact. In many manufacturing companies, these categories are characterized by a very high number of item codes and a particularly fragmented supplier base, leading to an increase in activities. It is not uncommon to observe a distribution attributable to the Pareto principle: a relatively limited share of total spending is associated with a very high number of codes and suppliers. Consequently, a significant portion of the purchasing department’s time is absorbed by managing operational activities that have a limited impact on the company’s competitive advantage.

In many cases, these categories coincide with the Not Critical quadrant of the Kraljic matrix: purchases necessary to ensure operational continuity, but characterized by low business impact and reduced supply risk. Precisely because of these characteristics, they often represent one of the most suitable scopes for evaluating a selective outsourcing model.

In this context, outsourcing offers an additional organizational advantage. It allows the management of a multitude of suppliers and codes to be concentrated within a single specialized interlocutor: it’s like transforming the management of 100 suppliers into that of a single partner responsible for the service. The company continues to define requirements, priorities, and service levels, while the external partner handles operational coordination, reducing management complexity and the number of interfaces to oversee daily.

Consignment Stock or Purchasing Center: Two Models with Different Objectives

A possible alternative to outsourcing is to entrust inventory management directly to suppliers through consignment stock or vendor-managed inventory (VMI) models.

These models help reduce some of the purchasing department’s operational activities, as the supplier handles stock replenishment based on agreed consumption. In many contexts, they represent an effective solution for improving material availability and reducing the risk of stock-outs.

However, consignment stock does not eliminate the complexity of the supplier base. If a company manages 100 suppliers for indirect or B and C class materials, it will still have to manage 100 commercial relationships, 100 master data records, 100 qualification processes, 100 purchasing conditions, and 100 different contacts.

A purchasing center operates according to a different logic. The goal is not only to ensure material availability but to concentrate the management of multiple suppliers and categories within a single specialized interlocutor.

In practice, the company replaces the operational management of dozens or hundreds of suppliers with a single partner responsible for the service. This partner will coordinate its network of qualified suppliers, ensuring material availability, operational continuity, and agreed service levels.

A further advantage concerns market competitiveness. For many industrial companies, B and C categories represent a marginal part of spending. For a purchasing center, however, they often constitute the core business. This creates a strong incentive to constantly monitor prices, availability, alternative suppliers, and possible substitute technological solutions.

The company thus benefits not only from a reduction in operational activities but also from a simplification of the supplier base, greater economic competitiveness, and the possibility of evaluating alternative products or technologies without having to dedicate specific internal resources.

Which Activities to Keep In-House, Outsource, or Evaluate Case by Case

The most useful decision is not “to outsource or not to outsource,” but to define the correct scope. A simple matrix can help distinguish activities based on strategic value, operational risk, repetitiveness, and the need for direct oversight.

Activities to Maintain Under Internal Oversight

Activities that determine the purchasing strategy and control over critical suppliers should remain internal. This area includes defining the vendor strategy, negotiating with key suppliers, selecting supply partners, managing the most relevant risks, and making decisions that directly impact the Supply Chain.

Keeping these activities internal does not mean performing them without support. It means that decision-making responsibility must remain within the company, with supporting data and analysis, but without delegating the governance of strategic choices.

Activities Suitable for Outsourced Management

Repetitive, measurable, and standardizable activities are more suitable for outsourcing. Concrete examples include supplier order management, standard reminders, document collection, updating operational information, monitoring order confirmations, and support for non-strategic categories.

These activities require method, consistency, and the ability to interface with suppliers and internal functions. If well-defined, they can be managed by an external partner with clear KPIs and shared processes.

In a more advanced approach, outsourcing can also include critical operational activities that generate internal inefficiencies or organizational overload.

An example is the management of supply constraints, such as Minimum Order Quantities (MOQ). An external partner, operating on a broader customer base and an aggregated supply network, can optimize these constraints by distributing volumes across multiple flows. This reduces the risk of overstocking or waste related to lots not fully absorbed, improving overall Supply Chain efficiency.

Activities to Evaluate Based on Risk and Company Maturity

Some activities are not automatically internal or external. The management of moderately critical suppliers, support for categories with variable production impact, or expediting materials at risk of line stoppage require more careful evaluation.

In these cases, three elements matter: the maturity of internal processes, the quality of available data, and the clarity of escalation rules. If priorities are not defined or data is unreliable, outsourcing risks inheriting problems already present in the organization.

How to Avoid Losing Control Over Suppliers, Costs, and Priorities

Loss of control does not depend on outsourcing itself, but on delegation structured without governance. A correct model defines what is delegated, who decides, what data is shared, how frequently performance is measured, and how exceptions are managed.

Control remains with the company when the external partner operates within a clear scope. This scope must include activities, categories, involved suppliers, levels of autonomy, approval rules, and responsibilities for results.

KPIs and SLAs to Govern the Service

KPIs and SLAs (Service Level Agreements) serve to transform outsourcing from simple operational delegation into a governed process. The indicators must be few, understandable, and linked to the purchasing department’s real objectives.

Examples of useful KPIs can include:

  • adherence to supplier-confirmed dates;
  • average order processing times;
  • percentage of orders confirmed within a certain interval;
  • number of reminders managed and closed;
  • quality and completeness of collected documentation;
  • number of escalations opened and resolution times;
  • accuracy of operational reports.

SLAs, on the other hand, define the expected service level: response times, update frequency, communication channels, reporting methods, and priority criteria. Without SLAs, the service risks being evaluated subjectively.

Roles, Escalation, and Operational Responsibilities

An effective outsourcing model is based on a clear separation between execution and decision.

The external partner operates autonomously within a defined scope; beyond this scope, they activate predefined escalation processes to the internal contact person.

Priority management is the critical element. Not all situations have the same operational impact: a delay on non-critical material can follow standard flows, while a risk on line components requires immediate escalation and joint management.

For this reason, the priority matrix and escalation rules must be defined before the service starts, not built during its operation.

Outsourcing, Temporary Management, Consulting, or Hiring: How to Distinguish the Options

Procurement outsourcing does not address all organizational needs. It is suitable when the company has continuous processes to oversee, operational activities to manage, and a delegable scope with sufficient clarity.

A new hire is more appropriate when the need is structural, internal, and linked to skills to be developed over time. A temporary manager is more suitable when a senior figure is needed to guide a transition phase, cover a managerial gap, or set up organizational change. Consulting is more appropriate when the objective is to analyze a problem, redesign a process, define a model, or build a roadmap.

The choice can also be combined. A consulting project can define the operating model, a temporary manager can guide the transition, and outsourcing can oversee a continuous part of the processes. The point is to avoid using the same tool for different criticalities.

Readiness Checklist Before Outsourcing Purchasing Processes

Before outsourcing the purchasing department, even partially, it is useful to verify if the company has the minimum conditions to govern the service. Outsourcing does not automatically correct unmapped processes, incomplete data, or contradictory priorities.

A readiness checklist can include these aspects:

  • purchasing processes are mapped at least in their main phases;
  • operational activities are distinguishable from strategic ones;
  • suppliers and categories are classified by criticality;
  • priority rules exist for orders, reminders, and escalations;
  • master data is accessible, updated, and usable;
  • internal contacts are defined for decisions and exceptions;
  • KPIs, SLAs, and reporting frequency are clear;
  • the external partner can integrate with company tools, procedures, and workflows;
  • the initial scope is sufficiently limited to be controllable;
  • Management and the Purchasing area share the objectives and boundaries of delegation.

If many of these points are unclear, the company might first need an assessment phase or process redesign. Outsourcing too early can transfer inefficiencies that should first be understood and rationalized.

A Pilot Model for Outsourcing Without Over-Delegating

A pilot project allows testing outsourcing within a controlled scope. It is a useful solution when the company wants to reduce risk, measure service quality, and verify integration with Supply Chain, production, administration, and suppliers.

The pilot can start with a non-strategic category, a group of B and C materials, a list of non-critical suppliers, or a specific activity like supplier reminders. The advantage is observing the model in real conditions, without immediately modifying the entire organization.

A well-designed pilot should include:

  • clear scope of activities, suppliers, and categories;
  • defined duration and measurable objectives;
  • initial KPIs and realistic targets;
  • shared escalation rules;
  • frequency of alignment between the external partner and the purchasing department;
  • final report with critical issues, results, and conditions for potential extension.

The pilot phase is not only for evaluating the service provider. It also serves to understand if the internal organization is ready to delegate, govern, and collaborate with a model different from the traditional one.

Frequently Asked Questions About Procurement Outsourcing

Does outsourcing purchasing mean losing control of the purchasing department?

No, if the scope is defined correctly. Control is lost when processes are delegated without KPIs, responsibilities, decision rules, and escalation criteria. In a selective model, the company maintains oversight of critical suppliers, purchasing strategies, and high-impact decisions, while the external partner manages operational or recurring activities.

Which purchasing processes are most suitable for outsourcing?

Repetitive, measurable, and standardizable processes are most suitable: supplier order management, order confirmations, standard reminders, document collection, data updates, support for B and C materials, or non-strategic categories. Strategic sourcing activities, critical negotiation, and selection of key suppliers, however, require strong internal oversight.

Does purchasing outsourcing replace a temporary manager?

Not necessarily. Outsourcing oversees continuous and operational activities; a temporary manager fills a managerial role or leads a phase of change. If the company needs recurring execution, outsourcing may be more appropriate. If, however, temporary leadership, reorganization, or management of a critical phase is needed, temporary management may be more suitable.

How is the quality of an external purchasing office measured?

Quality is measured through KPIs and SLAs linked to the process: order processing times, timeliness of confirmations, effectiveness of reminders, completeness of documents, number of escalations, accuracy of reports, and ability to meet agreed priorities. The evaluation must also consider the quality of the interface with internal buyers, suppliers, and involved company functions.

A Useful Choice When Scope, Control, and Responsibilities Are Clear

Procurement outsourcing is useful when it lightens the purchasing department without weakening governance. The value lies not in simple delegation, but in the ability to distinguish strategic and operational activities, critical and non-critical categories, internal decisions, and externalizable processes.

For an industrial company, the most solid choice comes from a concrete mapping: what absorbs time, what generates risk, which suppliers require direct oversight, and which activities can be managed with KPIs and SLAs. When these boundaries are clear, outsourcing becomes a tool for operational continuity and workload rationalization, not a relinquishment of purchasing department control.

Makeitalia also supports companies in the outsourced management of purchasing processes and activities.
If you are considering how to reduce your purchasing department’s operational workload or have a need to explore further, you can contact us via the contact page: we will be happy to analyze the context together and share some possible operational options.

Growth arrows and cost reduction for corporate performance optimization

How to Reduce Purchasing Costs in the Supply Chain with Method, Levers, and KPIs

Reducing purchasing costs in the Supply Chain requires a broader method than just price negotiation. Unit price remains a relevant element, but it is not sufficient to evaluate the real impact of a supply on margins, operational continuity, quality, and service.

For a Purchasing Manager or a Commodity Manager, the point is not to obtain an isolated discount, but to build measurable, internally defensible, and sustainable savings over time. This means reading cost drivers, segmenting categories, comparing suppliers on objective bases, and monitoring performance after the negotiation.

Effective cost reduction occurs when Procurement, Supply Chain, and Operations share a common logic: intervening where the economic potential is real, without shifting the cost to other corporate functions or increasing supply risk.

Reducing Purchasing Costs Does Not Only Mean Negotiating the Price

Reducing purchasing costs does not coincide with requesting lower economic conditions from the supplier. Negotiation is a lever, but it becomes weak when used alone, especially if the market has already absorbed previous negotiations or if the category is exposed to technical constraints, limited production capacity, or dependence on a few suppliers.

A structured approach starts from a different question: which cost components are truly manageable? Price can depend on raw materials, volumes, lots, delivery frequencies, technical specifications, required service levels, waste, urgencies, payment terms, or administrative complexity. Intervening only on price often means ignoring part of the problem.

For this reason, cost reduction in Procurement must distinguish between tactical actions and structural actions. The former act in the short term, for example through a renegotiation or a review of commercial conditions. The latter modify the causes of the cost: supplier base, specifications, processes, quality standards, procurement methods, and performance governance.

From Unit Price to Total Cost: Why TCO Changes Priorities

TCO, or Total Cost of Ownership, indicates the total cost associated with a supply throughout its management cycle. In industrial Procurement, it includes not only the purchase price but also indirect costs and operational consequences: quality controls, non-conformities, delays, safety stocks, urgencies, administrative activities, extra logistics costs, and interruption risks.

In practice, TCO answers a very different question compared to simple unit cost: how much does it cost overall, over time, to collaborate with this supplier?

Moving from unit price to TCO changes the way decisions are made.

For example, a component purchased at $1.00 might seem more competitive than one at $1.08. However, if the first requires more stock, generates returns, or involves frequent urgent shipments, the real total cost can become higher.

For this reason, indicators such as the following should be monitored:

  • total logistics cost;
  • inventory carrying cost;
  • cost of non-quality;
  • supplier service level;
  • tied-up working capital;
  • cost of operational emergencies.

TCO is therefore not just an economic analysis tool, but a decision-making approach that allows for the optimization of the entire Supply Chain, not just the negotiated price.

Graphic image of a bar chart report.

Apparent Saving and Sustainable Saving

Apparent saving occurs when the price decreases, but the overall cost does not improve or worsens. This happens, for example, when a reduction in unit price leads to less reliable delivery times, more acceptance checks, more follow-ups, or an increase in non-conformities.

Sustainable saving, on the other hand, produces a measurable economic benefit without compromising quality, service, and supply continuity. It is a saving that can be explained with data, linked to a specific lever, and monitored over time. For this reason, declaring a negotiated saving is not enough. It is necessary to understand if that benefit truly enters the income statement and if it remains stable in the following months.

A useful distinction is that between negotiated saving, booked saving, and consolidated saving. The first arises from the negotiation. The second is seen in the prices or conditions recorded. The third is confirmed when the economic effect remains valid even considering volumes, performance, quality, and indirect costs.

The Main Cost Drivers to Read Before the Negotiation

Before starting a negotiation with suppliers, it is useful to read the cost drivers of the category. A cost driver is a factor that contributes to the formation of the final cost and that can be, at least in part, influenced by technical, commercial, or organizational choices.

An effective negotiation does not start from the final price, but from the understanding of what generates it.

The most recurring drivers in industrial purchasing include:

  • purchased volumes, demand stability, availability of stable forecasts;
  • technical specifications and level of customization;
  • number of qualified suppliers available on the market;
  • impact of raw materials, energy, or labor;
  • minimum lots, delivery frequencies, and logistics conditions;
  • required quality level and costs of non-conformity;
  • lead time, flexibility, and production capacity of the supplier;
  • payment terms and contractual clauses.

This reading avoids generic negotiations. If the cost is driven by an overly restrictive specification, the lever will not be just commercial. If the problem is volume fragmentation, the lever will be consolidation. If the criticality is demand variability, the potential can be found in planning and requirement stability.

How to Identify Categories with the Greatest Saving Potential

A cost reduction plan should not start from the categories that are easiest to negotiate, but from those where the economic potential is significant and the intervention risk is manageable. Priority does not depend only on annual spend: a high-value category may have low potential if the market is rigid, while a less relevant category may offer concrete margins if it is poorly managed.

For this reason, it is useful to build a combined view of spend, complexity, technical criticality, number of suppliers, negotiation history, performance, and supply risk. The goal is to decide where to act first, with which lever, and with what depth of analysis.

An approach often used in strategic procurement is the Kraljic Matrix, which classifies categories based on two main variables: economic impact and supply risk. This allows for the differentiation of purchasing strategies, concentrating resources on high-impact or high-criticality categories.

Spend Analysis and Category Segmentation

Spend analysis is the starting point for understanding where the purchased value is concentrated and how it is distributed among categories, suppliers, plants, codes, and product families. Without this basis, the risk is chasing perceived but non-priority opportunities.

Effective segmentation can consider four dimensions:

  • economic value, i.e., how much the category weighs on the total purchased;
  • operational criticality, i.e., how much the supply affects production continuity and service;
  • technical complexity, how binding specifications or quality requirements are;
  • market competitiveness, how many alternative suppliers are actually available.

This reading allows for the distinction between categories to be renegotiated, categories to be tendered, categories to be standardized, and categories to be managed with partnership logic. Not all require the same action, and using the same lever everywhere reduces the effectiveness of the plan.

Category-Supplier Matrix to Define Priorities

The Kraljic matrix is a useful tool for defining the potential levers to activate and the intervention priorities in the purchasing field, crossing two key dimensions: the economic impact of the category and the supply risk. Simply put, it allows for the classification of purchases into different areas: high-value and low-risk categories, high-value and high-risk categories, low-value but high management complexity categories, and low-impact and low-criticality categories.

The approach changes for each area. For high-value categories and a competitive market, it may make sense to work on tenders, benchmarks, and Strategic Sourcing. For critical categories, however, cost reduction must be more prudent and based on TCO, vendor rating, supplier development, design to cost, and shared technical review.

Low-economic-impact but high-management-complexity categories require, instead, an approach focused on simplification and standardization, because the “hidden” cost of management can be higher than the purchase value. Low-criticality and low-value categories are typically managed with operational efficiency logic and minimization of management effort; in some cases, by outsourcing management.

The matrix also serves to manage internal expectations. Not all categories can generate the same type of saving, and not all savings have the same level of risk. Making this difference visible helps Procurement defend its choices before Management, Operations, and Quality.

Graphic of a bar chart report appearing on a hand.

Operational Levers to Reduce Purchasing Costs

Cost reduction levers must be chosen based on the category and the supplier context. A lever effective on standardized materials may be unsuitable for critical technical components. Similarly, a tender can work if the market is broad, but become risky if the current supplier possesses specific know-how or long qualification times.

The most solid logic is to build a portfolio of levers: some market-oriented, others oriented toward the relationship with suppliers, and still others toward internal specifications and corporate processes.

Strategic Sourcing and Market Scouting

Strategic Sourcing is the process by which the company analyzes the supply market, defines the strategy by category, and selects the suppliers most consistent with requirements, costs, risk, and expected performance. It is not a simple tender, but a method, with a structured approach applicable and shared by all internal stakeholders, to decide how to procure a category in the medium-to-long term.

Market scouting allows for verifying if real alternatives exist, what economic and operational conditions are actually feasible, if the price paid by the company for a certain component is aligned with the market, and how much the business depends on the current supplier. In some categories, especially those with high competition and low technical complexity, scouting can quickly generate new negotiation levers and immediate saving opportunities. In other situations, however, the main value of scouting is to build a progressive qualification plan over time, introducing credible alternatives and reducing dependence on single suppliers, without compromising production continuity, quality, or Supply Chain stability.

Supplier Base Rationalization

Supplier base rationalization consists of reducing, consolidating, or reorganizing the number of active suppliers when fragmentation generates management costs, volume dispersion, or low negotiation capacity. It does not mean eliminating suppliers indiscriminately, but distinguishing between strategic ones, replaceable ones, those to be developed, and those to be gradually phased out.

An overly broad supplier base can increase administrative activities, variability of conditions, control complexity, and monitoring difficulties. On the other hand, excessive rationalization can create dependence. For this reason, the choice must be guided by spend data, performance, risk, and technical capacity.

Standardization of Specifications and Requirement Review

Many purchasing costs arise before the negotiation, in the definition of specifications and requirements. Drawings, materials, tolerances, packaging, service levels, delivery frequencies, and customizations can generate complexity that Procurement inherits when the cost has already been determined.

Standardization reduces variants, exceptions, and low-rotation codes. Requirement review allows for verifying if what is requested is still consistent with real use. In an industrial context, this lever requires collaboration between purchasing, technical office, quality, planning, and operations.

Example: if multiple plants purchase similar components with slightly different specifications, the potential is not just negotiating a better price. It can be more effective to harmonize specifications, consolidate volumes, and reduce management complexity.

Data-Driven Negotiation with Suppliers

Data-driven negotiation uses data, benchmarks, volume trends, performance, and cost drivers to build a negotiation based on objective elements. This approach is more solid than a generic request for price reduction because it makes the reason for the intervention explicit and allows for discussing alternatives.

In some cases, a Cost Breakdown can support the comparison with the supplier, especially when the cost structure is influenced by raw materials, processing, energy, tooling, or labor. The Cost Breakdown must not turn into an isolated theoretical exercise: it is useful when it serves to identify shared levers and feasible decisions.

A well-prepared negotiation can include multiple options: lot review, framework agreements, volume commitments, technical modifications, new payment terms, differentiated service levels, or improvement plans. The supplier is not treated as a counterparty to be squeezed, but as an actor with whom to read where the cost is generated.

Graphic with the text "KPI" and digital backgrounds, associated with Makeitalia's purchasing and supply chain KPIs.

How to Use Vendor Rating and Purchasing KPIs to Maintain Savings

Vendor rating is a supplier evaluation system based on measurable criteria. It can include economic, qualitative, logistics, and service indicators. In the context of cost reduction, it serves to prevent the saving from being measured only at the time of negotiation and then lost in daily management.

Linking saving and vendor rating allows for reading the cost together with performance. If a supplier offers a competitive price but generates delays or non-conformities, the economic benefit must be re-evaluated. If a supplier maintains high performance, they can become a priority interlocutor for shared improvement projects.

Economic, Qualitative, and Service KPIs

Purchasing KPIs must represent the real behavior of the category and the supplier; they serve to avoid an evaluation based only “on price.” There is no set valid for every company, but some indicators are recurring in cost reduction projects.

A useful dashboard can include:

  • negotiated saving, to measure the effect of the negotiation;
  • realized saving, to verify the actual impact on orders and invoices;
  • price variance, to monitor deviations from agreements;
  • incidence of non-conformities, to read the cost of quality;
  • delivery punctuality, to evaluate reliability and service;
  • average lead time and lead time variability, to estimate impacts on planning and stock;
  • number of suppliers per category, to monitor fragmentation or dependence;
  • degree of supplier dependence, to identify single sourcing situations or excessive exposure to individual strategic partners;
  • supplier financial stability, to evaluate economic risk and the sustainability of the supply in the medium term;
  • quality of the relationship with the supplier, to monitor the level of collaboration, responsiveness, transparency, and ability to support improvements or management of critical issues;
  • contractual coverage, to understand how much spend is governed by formalized agreements.

The function of KPIs is not to produce reporting for its own sake. Their value lies in making deviations visible, facilitating decisions, and maintaining the link between Purchasing, Supply Chain, and Operations.

From Negotiated Saving to Consolidated Saving

A saving becomes consolidated when it is tracked in the systems, verified on real volumes, and confirmed by operational performance. This transition requires discipline: updated conditions, consistent price lists, order control, volume monitoring, and periodic comparison with suppliers.

Without governance, even a good negotiation can lose effectiveness. An agreed price may not be applied correctly, a forecast volume may not materialize, a technical modification may generate effects not considered. For this reason, the phase following the negotiation is an integral part of the cost reduction program.

Good oversight involves clear responsibilities: who validates the saving, who monitors the KPIs, who manages any deviations, who updates the conditions in the systems, and who communicates the effects to management.

An Operational Framework to Build a Cost Reduction Plan

A purchasing cost reduction plan should transform analysis into a sequence of decisions. The structure can be simple, as long as it is stable and shared.

An operational outline can include six steps:

  • map the spend, distinguishing categories, suppliers, codes, plants, and applied conditions;
  • segment the categories, crossing economic value, risk, complexity, and market competitiveness;
  • read the cost drivers, separating price, specifications, volumes, quality, service, and indirect costs;
  • choose the levers, avoiding applying the same action to different categories;
  • define KPIs and baseline, to measure the saving against a shared base;
  • build a timeline with milestones and a Gantt chart, to define responsibilities, expected timing, and monitor the actual progress of initiatives;
  • monitor consolidation, verifying economic impact and performance over time.

The baseline is the initial reference against which improvement is measured. It must be clear, shared, and consistent with the volumes considered. Without a baseline, the saving risks becoming an estimate that is difficult to defend.

The priority is not to build a complex model, but to avoid three recurring errors: treating all categories the same way, measuring only price, and not overseeing execution after the negotiation. A framework serves precisely to make the path repeatable and truly applicable.

Frequently Asked Questions About Reducing Purchasing Costs

What is the difference between price reduction and total cost reduction?

Price reduction concerns the unit value paid for a good or service. Total cost reduction also considers indirect costs, quality, lead time, urgencies, stock, non-conformities, and supply risk. For this reason, a price reduction does not always coincide with a sustainable saving.

When is it convenient to change suppliers?

Changing suppliers can be useful when the market offers qualified alternatives, the current supplier is no longer competitive, or performance is not consistent with corporate needs. The decision must, however, consider qualification times, operational risk, transition costs, and impact on supply continuity.

Which KPIs should be used to measure savings in purchasing?

The most useful KPIs combine economic and operational indicators: negotiated saving, realized saving, price variance, delivery punctuality, non-conformities, lead time, contractual coverage, and supplier base concentration. The choice depends on the category and the type of lever adopted.

How to prevent cost reduction from worsening quality and service?

Cost reduction must be evaluated together with quality and service KPIs. If the saving is measured only on price, it can generate negative effects on deliveries, waste, follow-ups, or production continuity. Integrated control between purchasing, quality, and Supply Chain reduces this risk.

Reducing Purchasing Costs as a Stable Procurement Capability

Reducing purchasing costs becomes effective when it is not treated as an occasional project, but as a stable Procurement capability. The method counts as much as the individual negotiation: spend analysis, TCO reading, category segmentation, supplier base management, KPIs, and governance allow for building more solid savings.

In an industrial Supply Chain, cost is not managed only at the time of negotiation. It is built in the specifications, in the requirements, in the choice of suppliers, in the measurement of performance, and in the ability to maintain results over time. This perspective helps Procurement protect margins without turning cost reduction into a risk for quality, service, or supply continuity.

If your company is also facing similar dynamics, it may be useful to discuss approaches and levers already applied in comparable industrial contexts. At Makeitalia, we support companies in structured cost reduction projects in the Procurement and Supply Chain fields, with a particular focus on the sustainability of results over time.

If you would like to learn more or evaluate a similar project for your company, you can contact us through the dedicated page: it will be an opportunity to understand together if and how to intervene, in a concrete way and consistent with your priorities.

MRP interface for requirements planning and production management

MRP Parameters: The Signals Indicating When Lead Times, Safety Stocks, Reorder Levels, and Order Quantities Should Be Reviewed

When stock and service levels begin to become unstable, the most immediate explanation tends to focus on demand, market variability, or operational pressure. In part, this is a legitimate reading, but it is not always the most useful one. In many contexts, the MRP system continues to generate proposals and coverage, but it does so based on parameters that no longer reflect the operational context. The point, therefore, is not just to understand if the system is working, but if it is working on assumptions that are still consistent with the flow it is supposed to govern.

This is precisely where the review of MRP parameters becomes central. Simply asking the team to intervene better, faster, or with more attention risks shifting the problem onto people, when the root of the instability is actually in the quality of the rules with which the system plans. If lead times, safety stocks, reorder levels, and order quantities remain unchanged while suppliers, delivery frequencies, production mixes, or service objectives change, the system continues to plan on bases that are no longer reliable.

Why the Problem Is Not Always Demand, but the Consistency of System Parameters

A planning system can appear orderly and, at the same time, produce increasingly unreliable results. This happens when the calculation logic remains stable, but the operational context evolves without the parameters being updated. In these situations, the problem does not necessarily arise from unpredictable demand. It arises from the fact that the system continues to react as if times, thresholds, and behaviors have remained the same as before, generating increasingly frequent exceptions, replanning, and manual interventions.

Reading the problem in this way also changes the type of intervention. The point is to verify if the system is supporting, in a balanced way, three objectives that should proceed together: service level, inventory optimization, and optimization of the process cost associated with order management. When one of these three elements worsens recurrently, it is useful to ask whether the origin is truly external, or whether it depends on the rules with which the system is planning.

The Parameters That Truly Govern MRP Behavior

One of the most frequent limitations when addressing this topic is reducing everything to lead times and safety stocks. They are certainly two crucial parameters, but they do not exhaust the picture. MRP behavior depends on a set of rules that define when the system must react, with what lead time, with what level of protection, and with what quantity to order. If this structure is read partially, the risk is intervening on a single parameter without correcting the overall mechanism that generates instability.

The lead time determines the time the system assumes is necessary to make a material available. If this data is underestimated, proposals arrive late and urgencies increase. If it is overestimated, the system anticipates too much and tends to generate excessive coverage. The safety stock, on the other hand, serves to protect the flow from variability, but loses effectiveness when it is dimensioned in a generic and indistinct way. In these cases, it does not protect better: it poorly distributes coverage among materials, criticalities, and service levels.

To these parameters are added the reorder level, i.e., the threshold that triggers the system’s reaction, and the order quantity, often linked to lot logic or criteria similar to EOQ. The reorder level defines when the system must start replenishment: if it is poorly calibrated, orders can trigger too early or too late relative to actual requirements. The order quantity, instead, directly affects the size of the proposals: if it is not consistent with consumption, procurement frequencies, and operational constraints, the system can generate an excessive number of orders or unnecessary accumulations.

For this reason, the review of parameters should never seek an absolutely valid formula. Rather, it should verify if each parameter is still helping the system make decisions consistent with the current context. A correct parameter, in this sense, is not the theoretically perfect one, but the one that allows the MRP to simultaneously support service, stock, and sustainable order management.

graphic with red alert symbol

Operational Signals Indicating a Parameter Review

The first recurring signal is the presence of stockouts or urgencies that repeat even in the absence of true exceptional demand peaks. When shortages emerge steadily on relatively predictable codes, it is difficult to attribute everything to market variability. More often, the system is reacting with times, thresholds, or protections that no longer reflect the actual behavior of the flow. In these cases, the lead time might not be updated, or the protection level might no longer be adequate for the actual risk.

Another important signal is the imbalance between overstock and shortage. The problem is not just having too much or too little, but observing a system that protects low-criticality materials and, at the same time, exposes truly sensitive ones to tension. This type of imbalance often suggests that safety stocks, reorder levels, and lot logic are not distributing coverage consistently with the criticality, consumption frequency, or actual variability of the materials.

A third signal is the increase in manual corrections. When planners and operations spend a growing part of their time anticipating orders, postponing dates, interpreting exceptions, or forcing decisions different from those suggested by the system, the problem cannot be read only as daily pressure. In many cases, this behavior indicates that the system continues to propose solutions that are not very credible on an operational level. When human work serves primarily to correct the basic logic, the parameterization deserves an in-depth check.

There is, then, a less obvious but very relevant signal: the presence of orders that are too frequent, too small, or excessively fragmented. In this case, the problem does not only manifest in the warehouse. It transfers directly to the purchasing department, which finds itself issuing more orders, managing more confirmations, following up on more reminders, and spending more time on administrative activities. Conversely, lots that are too large can reduce order frequency but generate more tied-up capital, more rigidity, and more difficulty in realigning the plan. In these cases, the order quantity is not just a warehouse parameter: it is also a direct lever on the efficiency of the purchasing process.

Why Inconsistent Parameters Also Worsen the Work of the Purchasing Department

An often underestimated aspect is that the impact of MRP parameters does not only concern overstock and service level. Inconsistent parameterization also changes the volume, quality, and frequency of the work required of the purchasing department. If the system generates too many proposals, too many micro-orders, or continuous exceptions to manage, the cost is not just logistical or financial. It is also organizational. Every additional order involves issuance, control, interaction with the supplier, monitoring of confirmations, and, often, management of reminders.

Updated planning therefore helps reduce stockouts, contain excess stock, and make the operational management of orders more sustainable. If the system generates a more consistent number of orders, with more sensible quantities and more stable frequencies, the purchasing department can work with greater continuity, less dispersion, and a better ability to focus on true priorities.

For this reason, the topic of parameters is not a purely technical issue. It concerns the way the company makes its planning and procurement system work. A poorly defined parameter does not just worsen the calculation. It shifts time, attention, and energy to repetitive or corrective activities that could be reduced with better system consistency.

Digital graphic with financial symbols and charts, associated with MRP parameters, planning, and supply chain procurement.

The Most Common Errors That Keep MRP Active but Unreliable

One of the most widespread errors is not reviewing parameters when suppliers, delivery frequencies, product mixes, production constraints, or commercial priorities change. Often, values are set in an initial phase with criteria, but then remain unchanged for too long. The system continues to generate output, and for this very reason, the problem can go unnoticed. There is no obvious breakdown of the mechanism, but a progressive loss of adherence to the operational reality.

A second error consists in using safety stock as generic compensation for problems originating elsewhere. When the system shows instability, increasing protection may seem like a prudent choice. In reality, if one does not distinguish between materials, criticalities, variability, and supplier reliability, the risk is building an indistinct barrier that increases stock without solving the structural problem. The same applies to lead time, when it is defined more by habit than by observation of actual behavior.

A third error concerns reorder levels and order quantities, which are often inherited from historical logic and remain active for simple continuity. This is how the system finds itself proposing orders that are too close together, too small, or, conversely, too large relative to the actual dynamics of consumption. In these cases, the problem is not the functioning of the MRP, but the quality of the parameters it is executing. For this reason, reorder levels and order quantities must be reviewed based on actual consumption, procurement frequency, and the organizational impact generated on purchasing.

How to Distinguish an Isolated Event from a Structural Parameterization Problem

Not every delay, urgency, or stockout requires a review of parameters. An important part of the planner’s work consists in understanding if the observed signal depends on a localized anomaly or on a configuration that requires a technical re-reading. An occasional supplier delay, an out-of-standard request, or a temporary demand tension can generate actual deviations, but they do not necessarily justify an immediate intervention on lead times, safety stocks, reorder levels, or order quantities.

The review becomes relevant when the signals do not remain isolated but begin to appear with a recognizable logic. If certain material families regularly show the same tensions, if certain codes always require the same type of correction, or if order fragmentation is concentrated in very specific areas, then the problem is no longer the single episode, but the way the system is interpreting that requirement. In this transition, the difference is decisive: the isolated event requires operational management, while the recurring pattern requires a technical reading of the parameters.

When It Makes Sense to Initiate a Criteria-Based Review of MRP Parameters

Once it is recognized that the problem is not episodic, the review should still not turn into an extensive and indistinct intervention. It makes sense to start with the materials, suppliers, or families that show the most evident impact on service, inventory, and order management. This allows for avoiding generic corrections and concentrating the analysis where the parameters are producing the most relevant distortions, both in terms of availability and in terms of operational load for planners and buyers.

An effective review therefore starts from the observation of the actual behavior of the system and the definition of clear priorities. It is necessary to read actual times, frequency and size of orders, distribution of exceptions, criticality of codes, and impact on the work of the purchasing department. Only in this way is it possible to understand which parameters have lost adherence to reality and which, instead, are still correctly supporting the flow. In this sense, the maintenance and periodic updating of MRP parameters are not a technical fulfillment, but a governance activity that helps the company maintain control, consistency, and reliability in planning.

At Makeitalia, we support companies in precisely this type of journey: we help planning, purchasing, and supply chain teams read the signals the system returns, identify areas where parameters have lost effectiveness, and set up a review consistent with operational objectives. If your company is experiencing signals of planning instability, we can help you analyze them and understand where to start. Let’s talk about it together: write to us here.

Digital graphic with blue backgrounds and technological symbols, associated with supply chain and ERP.

ERP Go-Live: Why It Is the Most Critical Phase of the Project

The moment of ERP system go-live represents the transition where months of design, configuration, and testing finally enter the company’s operational reality. Until that point, the project lives primarily in simulation environments, controlled procedures, and planned scenarios. From the day of launch, however, the system becomes the heart of corporate processes: orders, planning, logistics, and accounting begin to depend directly on its stability.

It is precisely in this phase that the most difficult-to-predict criticalities emerge. Even with a well-managed project, the introduction of a new ERP modifies operational habits, decision-making flows, and data management methods. For this reason, ERP go-live support and Key User coaching become decisive factors in ensuring operational continuity and reducing the risk of bottlenecks or inefficiencies in business processes.

ERP Go-Live as the Project’s Moment of Truth

From Project to Corporate Operational Reality

When an ERP system goes live, the project stops being a technical exercise and immediately becomes an integral part of corporate management. All processes previously supported by the legacy system or parallel tools begin to transition into the new information environment. In this phase, every configuration, parameter, or flow set during implementation must prove to work in daily practice.

For IT managers and Supply Chain managers, this transition represents a true solidity test of the entire ERP project. Even small inconsistencies in data or parameters can generate slowdowns in operational activities. Structured support during the launch allows these anomalies to be quickly intercepted and maintains control over business processes.

Why ERP Success Is Measured in the First Days of Use

The first few days after go-live concentrate most of the variables that determine the perception of the new system within the organization. Operational users must use different tools and procedures than in the past, and every difficulty is immediately perceived as a project problem.

It is precisely in this time window that operational support during ERP go-live takes on strategic value. An experienced team can quickly analyze critical situations, identify the cause of problems, and provide operational guidance to Key Users. This timely intervention allows a potentially critical phase to be transformed into a process of progressive system stabilization.

Most Frequent Criticalities During ERP Go-Live

Errors in Operational Flows and System Parameters

During an ERP launch, misalignments between theoretical configuration and the actual use of business processes frequently emerge. Planning parameters, order management rules, or warehouse settings can generate unexpected results when used on real data and in complex operational contexts.

These situations are not necessarily a sign of a poorly managed project, but represent a natural consequence of the transition between systems. The presence of expert consultants in ERP go-live allows for rapid intervention on critical parameters and the correction of operational flows before the impact propagates along the Supply Chain.

User Operational Difficulties in the New System

Another element that frequently emerges during go-live concerns the user experience. Even when training has been carefully planned, daily use of the system introduces variables that are difficult to simulate during testing. Operational activities, response times, and exception management can generate uncertainty among users.

Coaching ERP Key Users allows these situations to be managed in a structured way. Consultants can support users in the most critical operations, clarify correct procedures, and gather useful feedback to improve system usage. This approach reduces the risk of errors and accelerates organizational learning.

The Strategic Role of ERP Go-Live Support

Operational Coaching for Key Users

During the first weeks of using the new ERP system, Key Users play a central role. They are the internal point of reference for users and the direct link to the project team. However, in this very phase, they must face a high volume of requests, operational doubts, and unforeseen situations.

An ERP go-live support service allows this function to be strengthened. Consultants work alongside Key Users in the most complex activities, analyze anomalies, and help quickly identify corrective actions. This collaboration model allows a high level of operational control to be maintained without overloading internal resources.

Consultancy Support to Stabilize Processes

In addition to managing operational anomalies, support during go-live aims to consolidate business processes within the new system. The first days of use represent a valuable phase for observing the real behavior of flows and identifying any margins for improvement.

Through the monitoring of operational KPIs, execution times, and process exceptions, the support team can identify non-optimal configurations and suggest targeted interventions. This approach allows the system launch to be transformed into a phase of progressive process optimization.

Digital graphic with the text "ERP" and connection icons, associated with ERP support and the digital supply chain.

Reducing Operational Risk at the Decisive Moment

Organizational Preparation Before Launch

A significant part of ERP go-live success depends on the organization’s level of preparation. Verifying data quality, aligning system parameters, and clearly defining operational responsibilities are fundamental activities to reduce the risk of criticalities during launch.

In this phase, it is useful to adopt a structured approach involving both the IT team and process owners. The goal is to ensure that all business functions have a shared vision of operational procedures in the new ERP system and that the main scenarios have been verified before going into production.

The Value of an Experienced Partner in the ERP Launch Phase

The transition to a new system represents a moment of high exposure to operational risk. Even well-planned ERP projects can encounter difficulties if the organization does not have adequate support during the first weeks of system use.

For this reason, many companies choose to support their internal team with a partner experienced in ERP launch consultancy. Specialized support allows for the rapid management of criticalities, process stabilization, and ensures continuity for operational activities. In this way, go-live becomes not only the moment of system activation but the beginning of more structured and efficient management of business processes.

In our Digital Supply Chain journeys, what clients often ask us for is precisely end-to-end support in ERP projects. We accompany companies throughout the entire system adoption journey, ensuring integrated management of processes, data, and people. If you are also facing an ERP project, we are here to listen. Let’s talk about it together, write to us here.

Digital graphic with technological backgrounds and charts.

How Supply Chain Consulting Can Increase Corporate Profitability

The Economic Value of the Supply Chain: Measurable Benefits and Margins

Why the Supply Chain Directly Impacts Profitability

The Supply Chain is one of the most critical elements for corporate profitability. Every choice related to procurement, logistics, and material flow management has a direct impact on costs, timing, and customer service quality. An inefficient supply chain generates waste, line downtime, and economic losses, while optimized management allows for freeing up resources, increasing margins, and strengthening the company’s competitive position. In this context, the Supply Chain is not just a cost center, but a true engine of economic value.

Companies that invest in reviewing Supply Chain processes record tangible improvements: reduction in procurement costs, greater delivery punctuality, and less capital tied up in inventory. All these factors directly affect income statements and contribute to generating measurable and sustainable results over time. For this reason, now more than ever, the Supply Chain represents a strategic lever to increase the organization’s overall profitability.

Measuring Benefits as a Tool for Evaluating Operational Choices

Measuring the benefits of each project is essential for evaluating the effectiveness of the actions taken. Every intervention, from supplier rationalization to the optimization of logistical flows, must be supported by precise indicators that highlight the benefits obtained relative to the investments made.

This allows for clearly establishing which actions generate the highest returns and how to strategically allocate resources. In this way, operational decisions are based on concrete and measurable analysis, transforming the Supply Chain into an area where every choice is driven by the value produced.

A structured consulting approach aims to always make the link between operational initiatives and financial results evident, where possible. This means providing management with reliable analysis tools to understand, with data in hand, how much a specific action in the Supply Chain area contributes to increasing margins. In this way, consulting is not limited to proposing theoretical solutions, but becomes a concrete partner for the growth of corporate profitability.

Illustration with three-dimensional cubes, with one red one highlighted.

Supply Chain Consulting: Why It Makes a Difference

From Operational Support to Strategy

Relying on Supply Chain consulting means having access to specialized expertise capable of translating daily problems into long-term strategies. It is not just about improving individual processes, but about designing a more efficient, resilient, and growth-oriented organizational model. The consultant does not intervene as an external figure disconnected from the company, but rather as an operational partner working side-by-side with management to identify critical issues and define concrete solutions.

This collaboration allows for a broader and more objective view of company dynamics, going beyond simple operational management. Thanks to advanced analysis tools and validated methodologies, consulting supports the transformation of the Supply Chain into a strategic function, capable of directly impacting margins and competitiveness. The added value lies in the ability to integrate strategic vision and operational implementation, ensuring a measurable impact on business performance.

Operational Efficiency as a Profitability Lever

Waste Reduction and Flow Optimization

Operational efficiency is one of the most powerful levers for increasing corporate margins. Through an in-depth analysis of processes, it is possible to identify hidden waste that negatively affects profitability: downtime in logistics departments, duplication of activities, non-optimized purchase orders, low-rotation codes, obsolete planning parameters, or irrational logistical routes. A well-structured Supply Chain consultancy allows for the elimination of these inefficiencies and the construction of leaner flows, capable of reducing overall costs and improving the organization’s responsiveness.

Targeted interventions on supplier management, production planning, and warehouse organization lead to immediate and measurable results. Reducing operating costs means freeing up resources to reinvest in innovation, development, and competitiveness, generating a positive and lasting effect on financial statements. Flow optimization not only has a direct economic impact but also contributes to improving customer service quality, strengthening the company’s reputation in the market.

Improving Productivity and Customer Service

Another key aspect of operational efficiency is the increase in productivity. Making internal processes more fluid means reducing lead times, increasing production capacity, and improving delivery punctuality. All these elements have a direct impact on customer satisfaction, as they receive products or services faster and with greater reliability.

A well-structured Supply Chain consultancy supports companies in defining specific KPIs to measure not only logistical productivity but also procurement efficiency and planning quality. This allows for monitoring progress objectively and promptly activating corrective actions in all critical areas of the supply chain. Indeed, the structured analysis of KPIs transforms the Supply Chain from an operational function into a lever for continuous improvement for the entire organization. Operational efficiency, therefore, is not limited to reducing internal costs but becomes a lever for building stronger relationships with customers, strengthening competitiveness, and increasing overall profitability. An efficient Supply Chain represents a strategic asset capable of guaranteeing higher margins and sustainable growth over time.

Analysis and Cost Control in the Supply Chain

Analysis Tools for Informed Decisions

Cost control in the Supply Chain is based on the use of advanced analytical tools. Through simulation software, forecasting models, and scenario analysis, companies can evaluate the economic impact of different operational options before making decisions. This reduces risks and increases the ability to choose the most advantageous path.

Specialized Supply Chain consulting provides methodologies and tools to make these analyses an integral part of decision-making processes. Thanks to dedicated dashboards and detailed reports, management has a clear and updated view of costs, useful for guiding choices and monitoring results over time. In this way, analysis and control are no longer reactive activities but become proactive tools for generating value and consolidating corporate profitability.

Graphic with charts and glowing bars, associated with supply chain KPIs.

KPIs and Performance: Measuring to Improve

Definition and Monitoring of Indicators

To measure is to govern. In the Supply Chain, defining clear and measurable KPIs is the foundation for controlling processes, evaluating performance, and guiding corrective actions. Service level, punctuality, lead time, and inventory turnover are just some of the indicators that allow management to transform operational data into strategic decisions.

Constant measurement allows for the activation of a continuous improvement cycle: every deviation from objectives becomes a signal to intervene with corrective actions. In this way, the Supply Chain evolves from an operational function to a strategic control lever, contributing directly to the growth of corporate profitability. A competent Supply Chain consultancy guides companies in defining the most suitable KPIs and creating structured and reliable monitoring systems.

Benchmarking and Comparison with Best Practices

Relying on specialized consulting means accessing updated industry benchmarks based on cross-sector experiences in various industrial contexts. Comparison with best practices allows for correctly positioning the company relative to competitors, identifying performance gaps, and setting realistic yet challenging goals.

Thanks to the benchmarking provided by the consultant, management can evaluate the effectiveness of the strategies adopted in terms of benefits and competitiveness, integrating KPIs and comparative data into decision-making processes. In this way, measurement is not an end in itself but becomes a lever to guide high-impact operational choices and strengthen profitability over time.

The Concrete Approach of Makeitalia

From Data to Action

Makeitalia is the only Italian company 100% specialized in Supply Chain Management. Its strength lies in its concrete approach: every intervention is designed not to generate theory, but to produce measurable results. From cost reduction to supplier rationalization, from the improvement of logistical flows to the optimization of KPIs, every project is oriented toward guaranteeing a tangible benefit and consolidating corporate profitability.

The experience gained in complex sectors such as automotive, for example, allows Makeitalia to transfer operational know-how and validated methodologies. Companies that rely on this consultancy do not just receive analysis and reports, but practical tools to implement effective and sustainable solutions over time. This approach transforms the Supply Chain into a competitive advantage, capable of directly impacting margins.

Request a Supply Chain Assessment

If you want to understand how your company can get more from its Supply Chain, the first step is an objective evaluation of current performance. Makeitalia offers an Assessment to identify inefficiencies, analyze cost drivers, and propose targeted solutions. This path is designed to provide concrete answers to the needs of Supply Chain managers, procurement managers, buyers, planners, and logistics managers who want to transform the Supply Chain into a strategic profitability lever. Makeitalia consulting integrates analysis and action, offering targeted operational tools to increase efficiency, margins, and competitiveness.

Contact us here to discover how we can support you in improving operational efficiency, reducing costs, and increasing your company’s margins. With Makeitalia, Supply Chain consulting translates into concrete operational support, capable of transforming data into actions and actions into measurable results. A reliable, structured approach oriented toward the growth of corporate profitability.

Internal view of a logistics warehouse with a forklift and high shelving, associated with warehouse management and supply chain logistics.

Warehouse Management: Optimizing Spaces to Improve Efficiency

Every square meter of a warehouse tells a story: of moving materials, intersecting processes, and spaces that are worth time and money.
In an increasingly dynamic Supply Chain, proper warehouse management is a strategic lever to ensure efficiency and operational continuity.
Optimizing spaces does not just mean “tidying up,” but building a system capable of supporting growth, reducing costs, and increasing productivity.
Effective warehouse management is based on clear processes, reliable data, and shared responsibilities: essential elements for generating efficiency and stability in the Supply Chain.

Understanding Where Inefficiencies Arise

In many companies, the warehouse grows over time along with production activity, but without a true rethinking of the logistical model. This leads to situations where space no longer reflects operational needs: saturated areas next to empty zones, long travel paths, non-uniform shelving, and obsolete stock.

The main causes of inefficiency can be traced back to a few key factors:

  • outdated layout, designed for volumes or product mixes that are now obsolete;
  • high-turnover materials placed in poorly accessible positions;
  • irregular use of space, with congested areas and others underutilized;
  • misaligned inventory management, which generates tied-up capital and slowdowns.

The result is an increase in handling times and a reduction in overall efficiency.
To start a warehouse optimization journey, an objective snapshot of the current situation is needed: flows, handled volumes, picking and put-away times, actual saturation, and updated indicators on area utilization.
Only from an accurate initial diagnosis can concrete and measurable improvement begin.

View of a lit warehouse with shelving and goods, associated with the warehouse layout.

Rethinking the Layout Based on Flows

A well-designed layout is the starting point for efficient warehouse management.
Each area (receiving, storage, picking, and shipping) must be organized based on real flows to avoid crossovers and redundant, non-value-added paths.
The logical arrangement of zones and their correct sizing reduces distances, increases safety, and simplifies daily operations.

Some basic rules useful in design:

  • separate main flows, to avoid overlaps between receiving and shipping;
  • define the correct balance between automation and traditional solutions;
  • position materials based on frequency of use, keeping the most used ones in the most accessible areas;
  • ensure visibility and order, with clear signage and identified paths;
  • periodic updates, to align with changes in product mix or volume.

By respecting these simple rules, the layout becomes a tool for daily efficiency, capable of ensuring stability and efficiency over time.

Warehouse Space Management: Rules and Data for Efficiency

Optimizing space means governing it over time.
Every material must have a clear location, defined according to logical and shared criteria.
Management rules (based on dimensions, frequency of use, and compatibility) allow for increased saturation while maintaining accessibility and safety.

Here are some operational best practices:

  • define rotation categories (high, medium, low) to correctly assign positions;
  • classify materials by commodity category or product line, to exploit affinities and synergies;
  • standardize load units and pallet heights, to better utilize cubic space;
  • periodically update data based on seasonality and new flows;
  • eliminate obsolete or non-rotating materials that generate space waste.

To support these activities, ERP and WMS systems allow for the automatic management of storage rules, traceability, and inventory control.
The integration between digital tools and planning allows for the alignment of physical flows with information flows, reducing errors and superfluous movements.
By adopting these practices, the ability to predict, react, and maintain constant operational reliability of the warehouse and stock levels grows.

Digital graphic with gradient backgrounds and the word "ACTION," associated with performance improvement.

Monitoring Performance: Measuring to Improve

An optimized warehouse is a warehouse that measures.
Logistics KPIs are the starting point for evaluating the effectiveness of actions and for guiding data-driven decisions.
Among the most useful for Supply Chain Management, we find:

  • space utilization (%), to verify how much volume is actually being used;
  • operational productivity, i.e., packages or lines moved per work hour;
  • inventory accuracy, to monitor consistency between physical stock and the system;
  • material availability time, which measures warehouse responsiveness;
  • stock rotation index, to prevent obsolescence and excessive stock accumulation.

An excessive number of indicators is not necessary: a few, reliable ones linked to corporate objectives are enough.
With KPIs under control, it is possible to move from reactive management to proactive warehouse management, capable of continuously improving performance.

Involving People to Maintain Efficiency

No structural improvement can last without the involvement of people.
Warehouse operators experience the flows every day, know the difficulties, and can identify improvement opportunities before anyone else.
For this reason, it is fundamental to create awareness and spread clear, shared rules applicable to everyone.

Some levers to maintain efficiency over time:

  • clear procedures, error-proof and simple to follow;
  • constant training, to update skills and procedures;
  • periodic alignments between departments (and operational discussion moments);
  • visual management and signage, to promote order and safety;
  • shared responsibility, with measurable goals for each team.

Efficiency stems from method but is consolidated through corporate culture.
When order and improvement become part of the daily way of working, warehouse optimization transforms into a habit, not a temporary project.

Conclusion: From the Warehouse to Value for the Enterprise

Warehouse efficiency is not measured only in meters or time, but in the ability to adapt to changes and support the growth of the enterprise. Optimizing space means building a Supply Chain ready for the future. And Makeitalia can help you on this journey.

Would your company also like to improve warehouse management? You can contact us through the dedicated Contact page for an initial chat with us.

Computer screen with charts and data in an industrial or logistics setting.

Which KPIs Do You Use to Measure Your Supply Chain Success?

Decision-Making Data, Dashboards, and Advanced Control Tools

Supply Chain KPIs transform complex processes into clear, interpretable numbers capable of guiding decisions objectively. In the absence of structured indicators, planning is reduced to opinion, while logistics slides toward emergency and uncontrolled management. Furthermore, supplier management proceeds without direction. Conversely, a consistent set of KPIs allows for identifying bottlenecks, establishing quantifiable priorities, and linking operational choices to economic results.

An effective measurement system does not just collect data; it organizes it into functional dashboards and integrates it into control routines that ensure continuity and governance. Through targeted and updated indicators, management can monitor actual performance, prevent critical issues, and build a decision-making process based on concrete evidence.

Supply Chain KPIs: Why They Are Fundamental

Providing Visibility and Control to Processes

KPIs provide a common language between procurement, planning, production, and logistics. A well-defined indicator explains what to measure, how to calculate it, where to extract the data from, and what the target value is. This makes different departments and periods comparable, avoids arbitrary interpretations, and creates the foundation for rapid decisions. Transparency regarding numbers reduces process variability, limits non-value-added activities, and facilitates the prevention of line stops.

The most effective indicators are few, stable, and directly linked to strategic objectives. In the Supply Chain, the most solid framework for evaluating performance is represented by the Quality–Cost–Delivery (QCD) triangle: process and product quality, total cost of operations, and customer service level. Balancing these three dimensions avoids local optimizations that can generate side effects, such as indiscriminately reducing inventory with a negative impact on OTIF – On Time In Full or delivery quality. Monitoring QCD drivers in an integrated way allows decisions to be oriented toward the best compromise between efficiency, reliability, and customer satisfaction.

Measuring to Improve: From Data to Action

“What gets measured gets improved” is only true if measurement leads to action. Every KPI must have an owner, a warning threshold, a recovery plan, and a verification frequency. When an indicator falls out of range, the team knows who decides, by when, and which levers to use: MRP parameters, batches, delivery frequencies, saturation, layout, procurement or reordering methods. The value of the KPI is therefore twofold: it describes reality and activates a structured improvement cycle.

Over time, the maturity of the system grows. It starts with basic, highly accessible measures, then introduces more advanced indicators and segmentations by product, customer, supplier, and plant. This progressive path maintains control and increases the precision of choices.

Graphic with circular icons representing charts and a check mark, associated with supply chain KPIs.

Continuous Supply Chain Control and Monitoring

Operational and Strategic KPIs

Indicators are distinguished into operational and strategic. The former govern day-to-day operations: inventory accuracy, inbound punctuality, picking productivity, throughput lead time, % rework, vehicle saturation, waste, and damage. The latter measure the overall effect: service level (measured, for example, with OTIF – On Time In Full), inventory turnover, days of cover, logistics cost as a percentage of turnover, customer punctuality, and synthetic production efficiency indicators, such as OEE, when relevant to project objectives.

Linking the two levels avoids distortions: operational improvement must always be reflected in a measurable strategic benefit. If productivity increases but OTIF falls, the solution is incomplete. Consistency between levels ensures that operational initiatives support economic and service objectives.

Control Routines and Governance

Measurement without routines loses effectiveness. Robust governance includes: verification of critical deviations, weekly meetings for recovery plans, and monthly reviews with trends, root causes, and investment decisions. Each meeting has a “short list” of focal KPIs, assigned actions, and deadlines. This discipline creates reliability: people understand what matters, problems emerge early, and corrections are rapid. Over time, predictability grows and variability decreases, with direct effects on margins and customer satisfaction.

Operational Dashboards and Analysis Tools

Characteristics of an Effective Dashboard

A useful operational dashboard is simple to read, updated at a defined frequency, and built on certified data. It must show trends, targets, and thresholds, with drill-down capabilities by item, supplier, customer, and plant. Colors and visualizations are functional: traffic lights for thresholds, lines for trends, histograms for volumes, and tables for exceptions. The rule is one: every graph must support a concrete decision to be made today.

Consistency between definitions is crucial. If “OTIF” includes or excludes agreed-upon postponements, it must be stated. The data lineage is documented: source, transformations, frequency, and responsibility. Only then do numbers become reliable and shared across functions, avoiding sterile discussions about the origin of the data.

Digital Tools for Supply Chain Control

Tools can range from BI reports to dashboards integrated with ERP/WMS/TMS. The important thing is to ensure integrity, refresh rates consistent with the decision cycle, and the possibility of detailing down to the individual order. Useful functions: automatic alerts, contextual comments, history of target changes, and traceability of actions taken. Integrations with company systems — such as ERP, WMS, TMS, or planning modules — allow for closing the loop between KPIs and corrective actions: from data analysis to updating parameters, processes, or operational priorities, and vice versa. This alignment transforms the dashboard into an active tool, capable of generating timely interventions and driving continuous improvement throughout the Supply Chain.

Chess pieces placed on a surface with a red pawn in the center.

Data Analysis and Corporate Performance

Transforming Data into Decisions

The key step is linking KPIs to intervention levers. If OTIF drops, a range of causes opens up: incorrect MRP parameters, set-up times, insufficient capacity, inbound delays, or forecasting errors. The dashboard guides the diagnosis with filters by product family, supplier, and plant, until the most effective lever is isolated.

Every decision has a mini-business case: expected benefit, cost, implementation time, and impact on other KPIs. This “data → decision → impact” logic concentrates efforts where the effort/benefit ratio is highest. Subsequent monitoring closes the cycle, confirming or correcting the initial hypothesis.

Benchmarking and Market Comparison

Measuring well also means comparing oneself. Benchmarking places your KPIs against best practices and competitors. Not all sectors have the same reference values; therefore, the comparison must be normalized for mix, channels, and complexity. The goal is not to imitate, but to define realistic and ambitious objectives, consistent with positioning and commercial strategy.

Periodic comparison avoids the risk of distorted perceptions of internal performance; for example, a good service level may hide excessive costs or excessively high stock. Benchmarking integrates the internal reading and suggests where to invest to obtain the maximum return.

Practical Examples and KPI Applications

Concrete Examples of KPIs in Logistics and Operations

Service: OTIF (On Time In Full) measures the % of on-time and complete deliveries to the customer. To support this, specific indicators are used: “shipping punctuality” measures compliance with scheduled warehouse departure dates, while “delivery punctuality” evaluates compliance with the agreed arrival date at the customer. The distinction allows for identifying whether deviations depend on internal processes or the distribution network:

  • inventory. Days of cover and turnover measure capital tie-up and stock freshness;
  • efficiency. Picking productivity (lines/hour), throughput lead time, and vehicle saturation indicate resource usage;
  • quality. Inventory accuracy, % rework, damage, and waste quantify system reliability.

Linking these KPIs to operational drivers allows for targeted interventions: for example, if warehouse turnover increases but the number of stock-outs also grows, it is a sign that reordering policies are too aggressive; if turnover increases but OTIF falls, it could be that stock policies are too aggressive and are reducing product availability at critical moments. The relationships between indicators reveal real trade-offs and guide system optimization.

Checklist for Defining Corporate KPIs

To set up your set: define the purpose (which decision the KPI will guide), write the formula and data source, establish targets and thresholds, assign an owner, set the frequency and venue for verification, and specify the actions planned for out-of-threshold values. Then verify consistency between departments, drill-down possibilities, historical availability, and compatibility with the decision cycle. If an indicator does not generate decisions, it should be simplified or removed.

This checklist keeps the dashboard lean and action-oriented. A few well-constructed KPIs create discipline and results; many indicators without accountability dilute attention and slow down execution.

The Concrete Approach of Makeitalia

From Definition to Continuous Monitoring

Makeitalia supports companies in defining KPIs and building operational dashboards that link data, processes, and results. The work starts with a diagnosis of information quality, continues with the standardization of definitions, and translates into control routines that make indicators live and useful. The goal is to shift focus from reports to decisions.

Through a progressive path, the company gains visibility into cost drivers, increases delivery predictability, optimizes inventory and flows, and consolidates service levels. KPIs become the autopilot of the Supply Chain: a few clear numbers that indicate where to intervene and how much value is being generated.

Request a Check-up of Your Supply Chain

If you want to verify the effectiveness of your Supply Chain KPI set and build a truly reliable control system, request a check-up: we analyze the existing set, design a dashboard consistent with your objectives, and activate improvement routines that transform data into margins and service.

Contact us here for a personalized evaluation and start governing your Supply Chain with indicators that truly guide decisions.

Graphic with the word error written in red.

Common Errors in Supply Chain Management: How to Recognize and Address Them

In the world of the modern supply chain, every error, even a small one, can generate critical delays, hidden costs, and systemic inefficiencies. Often these are known but normalized problems: an outdated parameter, a late delivery, a duplicated process. This article was created to help managers and professionals recognize the most frequent errors in supply chain management and intervene concretely, with a structured and operational approach.

Through real examples and applicable solutions, we will address common dysfunctions, signs of inefficiency, and corrective logic, highlighting the role of specialized consultancy and continuous improvement. A path designed for those who want to transform their supply chain from a cost center into a strategic lever.

Why It Is Important to Recognize Errors in the Supply Chain

Impact on Costs, Lead Times, and Reliability

In today’s industrial context, even a single error in the supply chain can generate chain reactions on delivery times, service levels, and cost structures. Production delays, excessive or poorly distributed stock, incomplete orders: every dysfunction translates into a direct economic impact or a loss of reliability perceived by the customer. The timely identification of errors is no longer an option, but a strategic necessity.

Often these errors are not visible because they are distributed across multiple levels or attributed to external factors. In reality, many inefficiencies stem from outdated management choices, inconsistent metrics, or poorly controlled flows. Recognizing them means paving the way for targeted and measurable interventions.

The Difference Between Systemic and Episodic Errors

It is fundamental to distinguish between an episodic error — linked to an isolated event — and a systemic error, which repeats over time and stems from an incorrect structural configuration. Systemic errors are the most dangerous because they tend to be tolerated or underestimated, becoming part of the daily “way of operating.”

Intervening in an episodic error can solve a contingent problem. But only the identification and management of systemic errors allows for a real leap in quality in the supply chain. This is where analytical tools, professional assessments, and continuous improvement methodologies come into play.

The Most Frequent Operational Errors in the Supply Chain

Lack of Traceability and Obsolete Parameters

One of the most widespread errors in supply chain management is the absence of effective flow traceability. When data is not centralized, updated, or shared between departments, it becomes impossible to react in real time to changes in demand or production contingencies. This leads to decisions based on perceptions rather than evidence, generating recurring inefficiencies and waste.

Added to this is the use of obsolete parameters in ERP systems, such as outdated standard times, fictitious lead times, or minimum reorder values inconsistent with operational reality. The result is incorrect planning that compromises the entire downstream logistics flow, fueling emergencies and instability.

Recurring Delays and Invisible Waste

Many companies live daily with delays in material delivery, production overloads, or logistics bottlenecks. Often these problems are managed with temporary fixes that hide the symptom but do not solve the cause. True waste — such as invisible waiting times, redundant processing, or unnecessary movements — remains submerged and is not mapped.

It is precisely in this gray area that the most costly and least traceable errors lurk: planning errors, incorrect coding, lack of alignment between the warehouse and production. Identifying them requires methodical observation and an approach oriented toward continuous improvement, not just emergency management.

Logistics Inefficiencies: When Flows Betray Strategy

Poorly Balanced Warehouse and Redundant Paths

A common, often underestimated error concerns warehouse management and the design of logistics paths. An inefficient layout, with products positioned non-strategically or flows that run counter to production logic, generates slowdowns and increases internal costs. The warehouse becomes a center of congestion instead of a fluid support for production.

Furthermore, the lack of consistent storage policies can lead to accumulations of useless material, non-rotating stock, or recurring shortages. The balance between availability and rotation is delicate and requires continuous monitoring, reliable data, and effective governance of physical and information flows.

Downtime and Non-Integrated Flows

The most subtle inefficiencies are those that are not seen: downtime between one process and another, waiting during movement, flows that break down due to a lack of synchronization between departments. When production, the warehouse, and logistics do not communicate, each area tends to optimize itself independently, to the detriment of the overall system.

An efficient flow is, first and foremost, an integrated flow. This means sharing data, synchronizing activities, and managing interdependencies proactively. Recognizing where flows get stuck is the first step to redesigning them with lean logic and creating a reactive, sustainable, and effective system.

Illustration of a logistics line with a red error symbol.

Wrong or Unused KPIs: An Error to Avoid

The Illusion of Partial Data

Monitoring the supply chain without a consistent and functional KPI structure is like navigating without a compass. Many companies collect a large amount of data but interpret it partially or out of alignment with strategic objectives. Often, easily measurable indicators — such as stock levels or the number of orders issued — are prioritized, while those truly significant for global performance are neglected.

The error arises when data becomes an end in itself: a dashboard full of numbers does not guarantee control if it is not linked to clear decision-making processes. Without an integrated and updated KPI model, the supply chain risks being managed on a reactive basis rather than a proactive one.

How to Build Truly Useful Indicators

KPIs must be designed starting from operational goals: reducing costs, improving service, increasing reliability. Some key indicators include:

  • OTIF (On Time In Full): a real measure of reliability toward the customer;
  • Inventory Turnover Rate: useful for avoiding overstock and space inefficiencies;
  • Procurement Lead Time Compliance Percentage: essential for supplier control;
  • Cost to Serve: calculates the real cost to serve a customer or segment.

The key is not just to “measure,” but to use data to make better decisions. An effective KPI system supports continuous improvement, facilitates the monitoring of results, and makes the impacts of corrective actions visible.

The Value of an External Assessment and Operational Consultancy

Diagnosing with Method: What a Consultant Really Does

When inefficiencies accumulate and flows become opaque, an external look is needed to clearly map the real criticalities. A professional supply chain assessment does not stop at verifying process compliance but delves into operational performance, interdependencies, and organizational gaps. Through interviews, data analysis, and direct observation, the consultant builds an objective snapshot of the AS-IS system.

This diagnostic phase is the heart of every improvement intervention: only what is measured can be improved. Makeitalia, in particular, works alongside operational teams to identify critical nodes, propose concrete TO-BE scenarios, and support the implementation of solutions, with an approach based on real experience and tangible results.

Supporting Decisions with Benchmarks and TO-BE Scenarios

The added value of consulting support is not only in the analysis but in the ability to provide industry benchmarks, validated best practices, and sustainable operational proposals. Comparison with similar realities allows for an understanding of the real positioning of one’s supply chain and inspiration from models already effective in comparable contexts.

Through the development of TO-BE scenarios, consultancy translates the identified problems into concrete intervention roadmaps. The result? An evolutionary strategy, supported by data, that allows for a transition from emergency management to structured improvement. This is where the supply chain truly begins to generate value.

Digital graphic with a hand interacting with technological and glowing icons, associated with consultancy and assessment.

From Problem to Solution: The Path of Continuous Improvement

Acting on What Matters: Priorities and Operational Roadmap

Supply chain improvement does not happen by trial and error, but through a structured plan based on real priorities. After identifying errors, it is essential to define an order of intervention that takes into account the impact on costs, service quality, and production capacity. Not everything can be improved at the same time: a clear, shared, and realistic roadmap is needed.

Makeitalia adopts an approach that starts from objective measurement to guide decisions. This allows efforts to be concentrated on what generates concrete value, avoiding dispersion. Continuous improvement thus becomes an operational practice, not an isolated project.

Tools for Intervening with Method and Concreteness

Among the most effective tools for activating real improvement, we find:

  • Value Stream Mapping (VSM): to map flows and identify hidden waste;
  • ABC-XYZ Analysis: to rationalize codes and procurement policies;
  • Advanced KPIs: to monitor the impact of actions over time;
  • Operational Workshops: to involve teams and generate ownership of the change.

The real qualitative leap occurs when improvement is no longer a reaction to a problem but part of the operational culture. A truly efficient supply chain is a supply chain that evolves every day, thanks to reliable data, method, and involved people.

Request a Supply Chain Assessment

If you recognized in this article some of the problems you experience daily, it is the right time to move from analysis to action. Every unaddressed error generates waste, instability, and lost opportunities. But every inefficiency can become an opportunity for growth if addressed with method and the right support.

Makeitalia offers a consulting approach based on direct experience, concrete tools, and measurable results. Requesting an assessment of your supply chain means accessing an objective analysis and obtaining an improvement roadmap tailored to your operational reality.

Request a consultation now to start optimizing your flows and transforming errors into competitive advantages. The first step is simple: deciding to intervene.

Graphic with a red button alert symbol.

Who Are Critical Suppliers and Why Is Managing Their Risk Essential?

In an increasingly dynamic and interconnected business environment, identifying critical suppliers is one of the strategic priorities for safeguarding supply chain efficiency. These suppliers are essential for the company’s daily operations, but managing them requires attention and precision. If neglected, they can cause production interruptions, unexpectedly increase costs, and undermine the stability and overall profitability of the company.

Adopting a proactive approach to managing critical suppliers not only allows for the avoidance of immediate damage but also helps ensure the resilience and sustainable growth of the company in the long term.

But how exactly do you define a critical supplier and recognize one in a timely manner? How can you integrate effective supplier qualification into the selection process to ensure the chosen partner is reliable and capable of meeting business needs? What signals should you be able to read to prevent future problems? And what tools and KPIs should be used to monitor and report them effectively within the organization? Furthermore, if critical issues are identified, what corrective actions need to be taken?

Ignoring these questions can lead to severe consequences, including the loss of strategic contracts, uncontrolled cost increases, or irreversible damage to corporate reputation.

In this article, we will explore how to address these crucial topics, providing practical guidance on how to identify, qualify, monitor, and manage critical suppliers, minimizing risks and maximizing long-term value for your business.

How to Identify a Critical Supplier?

Not all suppliers are equal. Some can be easily replaced without significant impact, while others are so relevant that they could jeopardize the entire business operation. But how do you recognize a truly critical supplier?

To understand this, it is useful to distinguish between two main categories:

1. Suppliers Critical for Strategic Importance

These suppliers are fundamental to the operation, quality, or competitiveness of your company. Here are some key indicators:

  • Difficulty of replacement: If finding an alternative is complex or time-consuming, the supplier is critical. This is the case for those using proprietary technologies, having unique production processes, or holding specific certifications. The longer the lead time to qualify a new supplier, the greater your dependence on the current one.
  • Impact on costs: If a supplier significantly affects the cost of the final product, any price increases can erode your margins. Additionally, suppliers operating in a monopoly or dealing with raw materials subject to high fluctuations represent an economic risk.
  • Role in innovation: Some suppliers are true strategic partners because they develop advanced technologies or provide essential components for the evolution of your products. Protecting and enhancing this relationship is fundamental to maintaining a competitive advantage.

2. Suppliers Critical for Risk Exposure

Other suppliers become critical not so much for the value they bring, but for the potential problems they can cause. Here is what to evaluate:

  • Financial and organizational stability: A supplier with economic problems, frequent changes in ownership, production difficulties, or staff reductions can become unreliable. Analyzing financial statements, investments, and corporate structure helps predict potential future criticalities.
  • Logistical and production reliability: Recurring delays, failed deliveries, or an organization that is not responsive to unexpected events can generate production downtime. A supplier without business continuity plans is a concrete risk to your supply chain.
  • Product or service quality: A high rate of non-compliance, product recalls, or qualitative variations between batches can generate extra costs, waste, complaints, and reputational damage. The presence of certifications, rigorous quality controls, and traceability is a fundamental requirement.
  • Exposure to external factors: Suppliers located in geopolitically unstable areas, who depend on rare materials or complex transport, are more vulnerable. International crises, trade restrictions, and currency fluctuations can compromise their operational reliability.
A handshake against a digital technological background with blue and orange tones, associated with reliable partners in the supply chain.

Supplier Qualification: The First Step to Choosing Reliable Partners

The supplier qualification procedure is your first line of defense against risks. It is the starting point for ensuring that selected partners are reliable, competent, and aligned with company standards. A well-structured qualification allows not only for the prevention of critical issues but also for building solid and transparent relationships.

Here are the key phases for effective qualification:

1. Preliminary Phase: Suitability Analysis

In this phase, basic information is collected to evaluate whether a potential supplier meets the company’s minimum requirements. The main parameters include:

  • Industry experience: A long presence in the market is an indicator of stability, competence, and operational reliability. Do not underestimate the importance of an experienced partner.
  • References and track record: The experiences of other customers provide concrete indications of service quality, punctuality, and problem-solving ability. Testimonials can reveal much more than a contract does.
  • Quality certifications: Recognized certifications (e.g., ISO 9001, IATF 16949, ISO 14001) attest to compliance with international standards and consolidated procedures. A certified supplier is a trusted supplier.
  • Financial stability: A company with a good financial position is less subject to risks of insolvency or sudden supply interruptions. Checking financial statements is a fundamental step to ensure continuity of supply.

2. Audit and Documentary Verification

In this phase, we move to the concrete validation of the information collected and the verification of the supplier’s operational capacity:

  • On-site audit: Direct inspection of production facilities, operational flows, and quality control systems. It serves to confirm that declarations are consistent with reality.
  • Documentary analysis: Formal verification of certifications, technical documents, procedures, and updated financial statements. Documentary transparency is an indispensable condition.
  • ESG Evaluation (Environmental, Social, and Governance): More and more companies consider sustainability criteria a strategic element. Compliance with ESG policies demonstrates responsibility and long-term vision.

3. Production Testing and Technical Validation

This phase allows for testing the compliance and actual performance of the products or services offered:

  • Sample production: Serves to evaluate the consistency and product compliance with the required technical specifications, from both a qualitative and functional point of view.
  • Technical tests and application trials: Samples are subjected to functional tests and trials under real operating conditions to identify potential criticalities and ensure the performance of the final product.

4. Continuous Monitoring: Qualification Is Not a Final Destination

Once the selection phases are completed and tests are passed, the supplier is formally qualified. However, qualification represents only the beginning of a structured and lasting partnership, not a finish line.

It is therefore fundamental to:

  • Define a periodic performance monitoring plan;
  • Perform re-audits at regular intervals;
  • Review the qualification in case of non-compliance, organizational changes, or changes in the supply context.

Operational Tools for Supplier Evaluation

Effective management of critical suppliers requires formal and standardized tools. Here are the main tools that can be used:

  • Vendor Rating: A scoring system that assigns a numerical value (e.g., 0–100) to each supplier, based on KPIs such as OTD, quality, lead time, and documentary compliance. Useful for periodic rankings and strategic decisions.
  • Supplier Scorecard: A summary table where each KPI is associated with a weighted score. It allows for objective evaluations and comparisons between different suppliers. It is often integrated into the Vendor Rating.
  • Vendor List: An official and periodically updated list of qualified suppliers. It includes master data, performance history, and current status (e.g., active, under observation, suspended).
  • Audit Checklist: An operational tool for on-site or documentary verifications. It includes mandatory and optional items, each with a score. It allows for certifying compliance with technical or contractual requirements.
  • Supplier KPI Dashboard: A visual platform for the continuous monitoring of logistical, qualitative, and contractual performance. It allows for automatic alerts and sharing between purchasing, quality, and operations.

How to Monitor Critical Suppliers: KPIs and Corrective Actions to Maintain Control

Relying on critical suppliers involves inevitable risks. However, through the continuous monitoring of the right KPIs and the implementation of timely corrective actions, it is possible to prevent service disruptions, mitigate risks, and ensure operational continuity.

1. On-Time Delivery (OTD)

On-Time Delivery measures the percentage of on-time deliveries compared to the promised date. It is an essential indicator of the supplier’s logistical reliability.

Define an internal reference target and identify suppliers that deviate significantly. In case of performance below expectations, it is useful to plan regular meetings to analyze the causes and implement an alert system for delays, so as to be able to intervene in real time.

2. Supply Quality (PPM – Parts Per Million)

PPM measures the number of defective parts per million units delivered. It is a critical KPI for evaluating product compliance and the reliability of the supplier’s production process.

If the value exceeds the defined threshold (target value), trigger a root cause analysis (e.g., 8D method) and request a structured improvement plan. It is important to analyze the trend over time to intercept systemic problems or negative trends.

3. Actual vs. Promised Lead Time

This indicator compares the actual delivery time with the one declared by the supplier. An unstable lead time or one longer than promised can compromise production planning and increase inventory costs.

In case of significant deviations, it is advisable to initiate a direct discussion to identify bottlenecks. Consider adopting safety stocks, but also optimizing demand forecasts to align expectations and supplies.

4. Bilateral Dependence (Spend Share % and Customer Weight)

Excessive dependence, both of the company on the supplier and of the supplier on the company, represents a risk. If you depend too much on a single supplier, a problem on their end can block your operations. If they depend too much on you, they may become fragile and less resilient in the long term.

To manage the risk:

  • Define a target value for mutual dependence that should not be exceeded.
  • Check it annually during the purchasing budget planning.
  • Initiate rebalancing actions if necessary (e.g., dual sourcing, developing new suppliers).

5. Supplier Financial Stability

A supplier with economic problems can become unreliable and, in the worst cases, suddenly cease operations.

Periodically check financial statements, financial ratios, and credit ratings. If signs of deterioration emerge, evaluate a reduction in commercial exposure, modify payment terms, and, if necessary, look for alternative suppliers with greater stability.

6. Geopolitical Risks and External Exposure

Suppliers located in high geopolitical risk areas, subject to tariffs, or dependent on fragile infrastructure are more vulnerable to disruptions.

Regularly perform a country risk analysis and evaluate exposure to external factors such as political instability, natural disasters, or health crises. In case of high risk, consider strategic relocation or expanding the supply network.

Digital graphic with a world map and blue tones, associated with geopolitical risks in the supply chain.

Corrective Actions: How to Strengthen Collaboration in Critical Moments

When KPIs highlight critical issues, it is important to intervene in a structured way, but always with an approach oriented toward collaboration and mutual improvement.

Implement an escalation plan to address problems. Here are some effective actions to take:

  • Root cause analysis: Jointly identify with the supplier the real causes of problems (not just the symptoms) through structured tools like the 5 Whys or 8D analysis.
  • Shared improvement plans: Agree on concrete actions and realistic timelines to return to expected service levels, maintaining a continuous dialogue.
  • Joint review of forecasts and planning: Better align demand and production capacity to avoid strain on the supply chain.
  • Operational support and training: If necessary, offer technical or training support to strengthen processes and skills.
  • Risk mitigation strategies: In some cases, it may be useful to evaluate forms of supply diversification, for example by adding complementary or alternative suppliers for specific materials or processes with the goal of strengthening operational continuity, reducing vulnerability to external factors, and ensuring a greater response capacity in critical situations.

Toward Strategic Management of Critical Suppliers

Managing critical suppliers is a complex but essential task to ensure operational continuity and company competitiveness. Through accurate supplier qualification, constant KPI monitoring, and the implementation of timely corrective actions, you can minimize risks and maximize long-term value. Do not overlook the importance of these aspects: proactive management of critical suppliers can make the difference between the success and failure of your supply chain. The key is to always be one step ahead, ready to respond to challenges and seize opportunities.

Professional analyzing a network of nodes and connections to optimize Supply Chain processes

The Role of the Purchasing Manager in the Supply Chain

An Increasingly Strategic Purchasing Function

From Operations to Contributing to Corporate Results

In an increasingly unstable and interconnected industrial scenario, the Purchasing Manager is no longer just responsible for orders or budget compliance: today, they are a strategic player within the Supply Chain, with a direct impact on efficiency, resilience, and competitiveness.

The transition from a purely operational function to a performance-oriented role requires advanced management of suppliers, costs, and information flows. This means anticipating supply criticalities, supporting corporate decisions with reliable data, and making a concrete contribution to waste reduction and process optimization.

The figure of the Purchasing Manager is now at the crossroads of industrial strategy, production planning, and supplier management, becoming a benchmark for building a more reactive, sustainable, and integrated supply chain. Their contribution is measured not only in terms of savings, but in the ability to guarantee operational continuity and consistency between economic objectives and material availability.

In this context, integrating advanced decision-making techniques and digital tools becomes fundamental to improving the oversight of the purchasing function. Data, simulations, and reliable indicators represent essential levers for generating value and making informed decisions with a view toward continuous improvement.

Specific Responsibilities of the Purchasing Manager

Supplier Management, Contract Negotiation, Cost Control

The Purchasing Manager oversees a crucial area of the organization: supplier management. Selecting reliable partners, building long-lasting relationships, and negotiating contracts that protect the company in terms of costs, quality, and timing are activities that require specific skills and a structured approach.

Effective contracting is not just about price, but includes strategic elements such as guaranteed delivery times, service level agreements (SLAs), penalties for delays, minimum stock levels, or flexibility commitments. In this light, the Purchasing Manager becomes a value mediator between corporate objectives and market possibilities.

Cost monitoring represents another pillar of the function. Analyzing variances from the budget, identifying recurring extra costs, and building comparative reports between suppliers allows for spend optimization and the timely identification of any inefficiencies.

Graphic illustration of a puzzle joining people together.

Alignment with Production and Requirements

One of the key responsibilities of the Purchasing Manager is to ensure consistency between production planning and material availability. This alignment does not necessarily imply direct oversight of operational procurement, but requires continuous collaboration with production and logistics to define requirements, lead times, optimal lots, and strategic stock levels.

Through a data-driven approach and predictive analysis techniques, it is possible to anticipate demand peaks, avoid stockouts, and limit tied-up capital in the warehouse. Value is generated not only in the purchase, but in the ability to integrate the purchasing process into the broader Supply Chain ecosystem.

In this context, advanced decision support tools and specific KPIs (such as average unit cost, variance from budget, on-time delivery rate, time-to-contract) become fundamental levers for improving efficiency and control.

Purchasing and Supply Chain: A Fundamental Link

How Purchasing Choices Impact Logistics and Procurement

Decisions made by the Purchasing Manager have concrete repercussions on the entire Supply Chain, even without direct operational involvement in logistics. The choice of suppliers, supply conditions, volumes, and Incoterms influences physical flows, transport costs, reception times, and the ability to guarantee production continuity.

For example, the definition of purchase lots, delivery frequency, and return conditions can impact vehicle saturation, internal handling, and stock levels. Similarly, non-optimized choices during the purchasing phase can translate into hidden logistical costs or avoidable operational complexities.

It is therefore fundamental that the Purchasing Manager operates with an integrated vision, evaluating the effect of their decisions along the supply chain. This approach values the contribution of the purchasing function to global performance, rather than limiting it to mere direct cost reduction.

Coordination with Logistical Functions Without Overlap

While operating in distinct areas, purchasing and logistics share common goals: efficiency, continuity, and cost containment. Effective coordination between the two areas allows for avoiding overlaps, proactively managing bottlenecks, and improving the Supply Chain’s responsiveness.

Makeitalia promotes collaborative models that involve well-defined yet synergistic roles: the Purchasing Manager is responsible for supply conditions, while logistics oversees operational planning and the physical execution of flows. This integration allows for building data-driven and measurable decision-making processes, reducing waste and inefficiencies throughout the entire chain.

Aligning functions without operational duplication is one of the key principles of a modern and high-performing Supply Chain.

Illustration of a team of people observing charts during a meeting.

Measuring Purchasing Performance: KPIs and Critical Analysis

Data, Objectives, and Indicators for an Improvement-Oriented Function

A modern purchasing function must be measurable, transparent, and oriented toward continuous improvement. For this reason, the Purchasing Manager works with specific KPIs (Key Performance Indicators) that allow for evaluating the value generated, identifying areas of inefficiency, and supporting strategic decisions.

The main KPIs adopted include:

  • On-Time Delivery (OTD): measurement of supplier punctuality compared to planned delivery dates.
  • Average Unit Purchase Cost: analysis of average price trends over time by raw material or product category.
  • Procurement Lead Time: average time between order and material reception, useful for efficient production planning.
  • Contractual Consistency Index: comparison between agreed contractual conditions and conditions actually applied (e.g., prices, timing, penalties).
  • Savings vs. Budget: measurement of cost reductions achieved compared to set targets.

These indicators must be read from not only a quantitative but also a qualitative perspective to avoid tactical drift. A reduction in costs, for example, must not compromise the supplier’s reliability or flexibility.

Makeitalia supports Purchasing Managers with structured analysis, benchmarking, and reporting tools capable of transforming data into levers for improvement. The goal is to build a purchasing function that is increasingly solid, measurable, and integrated with business objectives.

Key Competencies of the Modern Purchasing Manager

Analytical, Negotiating, and Relational Skills

Regulatory Knowledge and Digital Support Tools

The role of the Purchasing Manager has evolved from an executive function to a strategic figure with cross-functional impacts on corporate efficiency, sustainability, and competitiveness. To respond to this transformation, a balanced set of technical competencies and soft skills is required.

Analytical Skills: the purchasing manager must know how to interpret data, evaluate complex offers, compare alternative scenarios, and make informed decisions supported by dashboards and KPIs. Total Cost of Ownership (TCO) analysis is a concrete example of how the analytical dimension impacts operational choices.

Negotiating and Relational Skills: conducting effective negotiations, establishing win-win relationships with suppliers, and building long-term partnerships are fundamental activities to guarantee stability and sustainable competitive advantages.

Regulatory Knowledge: the regulatory context (contracting, compliance, joint and several liability in the supply chain) requires attention and continuous updating. The Purchasing Manager must ensure compliance with rules and know how to manage risks related to commercial agreements.

Use of Digital Tools: the use of SRM (Supplier Relationship Management) platforms, tender management tools, performance monitoring systems, and dashboards integrated with ERP allows for more efficient and transparent management of the purchasing process.

Makeitalia supports purchasing professionals with training paths, decision-making tools, and targeted consulting to strengthen the key skills required by the market and foster professional growth consistent with the evolving needs of the Supply Chain.

How Makeitalia Supports the Purchasing Manager

A Technical Partner for Supplier Management, KPIs, and Cost Optimization

In a scenario where the purchasing function is increasingly integrated with corporate strategies, Makeitalia positions itself as an operational and strategic partner alongside the Purchasing Manager, offering concrete tools, skills, and methodologies to face daily challenges and generate value.

Supplier Management and Qualification: Makeitalia supports the selection, qualification, and monitoring of suppliers through objective evaluation models, targeted audits, and risk analysis. This enables the building of a solid, transparent supply base aligned with company objectives.

KPI and Performance Monitoring: thanks to experience gained in the field, Makeitalia helps the Purchasing Manager in the definition and tracking of key purchasing indicators to keep costs, punctuality, quality, and service under control, with an approach oriented toward continuous improvement.

Cost Optimization: through benchmarking, savings analysis, and cost breakdown activities, Makeitalia provides data and scenarios to support effective negotiations and choices based on TCO logic. The goal is to identify inefficiencies, eliminate waste, and generate tangible results.

The added value lies in the ability to intervene in a pragmatic and tailored way, supporting Purchasing Managers with projects that have a high operational impact yet are sustainable over time.

Contact us to discover how we can also support your purchasing function and contribute to the success of the corporate Supply Chain.

Professionals analyzing digital data for Supply Chain optimization

Logistics Digitalization: What Tools to Adopt

Why Digitalizing Logistics Processes Is an Urgent Need Today

From Operational Efficiency to Competitive Advantage

Logistics is currently one of the areas most exposed to external pressures: cost volatility, raw material shortages, increasing distribution complexity, and rising customer expectations compel companies to manage with ever-greater precision and responsiveness. In this scenario, digitalizing logistics processes is no longer a choice, but an operational and strategic necessity.

Integrating digital tools allows for improved visibility along the supply chain, reduced manual errors, automated repetitive operations, and data-driven decision-making. Most importantly, it means enabling new levels of control and predictability, which are fundamental for maintaining operational continuity and containing costs.

Digitalization is not just a technological investment, but an enabling factor for building a more agile, resilient, and efficient Supply Chain. Companies that adopt digital solutions early are those that better manage crises, anticipate demand fluctuations, and differentiate themselves from the competition.

Logistics Areas That Benefit from Digitalization

Warehousing, Transportation, Traceability, and Planning

Digitalizing logistics does not mean adopting complex technologies, but rather intervening in a targeted manner on processes that generate inefficiencies and costs. Makeitalia supports companies precisely in this: improving critical logistics areas through decision-making tools, flow analysis, and optimized operational models.

1. Warehousing

The physical organization of spaces and inventory management directly impact costs. Through targeted analyses, rotation classifications, and support for space utilization, it is possible to reduce inventory, improve picking, and contain fixed costs.

2. Transportation

Solutions such as the Milk Run model, route centralization, and load optimization allow for rationalizing the number of trips, reducing kilometers traveled, and cutting ancillary costs. Makeitalia assists companies in flow analysis and in defining logistics strategies based on real data.

3. Traceability and Control

Making logistics flows traceable means ensuring visibility and accountability throughout the entire chain. Through KPI monitoring, operational audits, and document validations, Makeitalia helps companies identify bottlenecks, delays, and areas with high economic impact.

4. Planning and Simulation

Effective logistics planning stems from the ability to simulate alternative scenarios, evaluate economic impacts, and choose the most advantageous options. Makeitalia supports companies with transport benchmarks, cost breakdowns, route simulations, and contractual validation of external services.

With a modular and practical approach, Makeitalia supports companies in building a more digital, controllable, and responsive logistics, without necessarily having to adopt complex IT solutions.

Automated warehouse with cloud technology for logistics and Supply Chain digitalization

Tools and Methods for More Digital and Efficient Logistics

Flow Optimization and Transportation Centralization

Logistics efficiency is built by acting in a targeted manner on how goods move within and outside the company. Makeitalia supports companies in mapping existing flows and in redefining the most critical paths, identifying waste, overlaps, and consolidation opportunities.

Simulations, Benchmarks, and KPI Control

Logistics digitalization also involves the ability to make decisions based on real data and reliable simulations. Makeitalia provides companies with support tools such as:

  • Simulations of alternative transport and warehousing scenarios
  • Market benchmarks to verify tariff alignment
  • Analysis and monitoring of logistics KPIs: punctuality, transit times, vehicle utilization, extra costs

These tools help logistics managers to monitor the effectiveness of adopted solutions, identify recurring criticalities, and take rapid and measurable corrective actions.

Document Digitalization and Operational Traceability

Manual management of logistics documents (DDT, CMR, contracts, SLAs, claims) generates inefficiencies and increases the risk of errors. Makeitalia, through a structured approach, can evaluate which of these documents can be digitalized, in order to centralize, track, and validate every interaction with transport providers.

Document digitalization can make logistics management more transparent and reliable, also improving interaction between purchasing, logistics, and administration departments.

Digitalization and Cost Reduction: How to Intervene in a Targeted Way

Cost Analysis, Vehicle Utilization, and Extra Cost Reduction

Reducing logistics costs does not simply mean cutting expenses, but precisely identifying where waste and inefficiencies are generated. Makeitalia operates through an analytical approach, which allows fragmented data to be transformed into operational information and targeted strategic choices.

The first step is the development of a detailed cost breakdown: mileage, loading/unloading times, number of packages, weight-volume, fuel surcharge, delays, contractual penalties. These elements are analyzed in relation to expected performance, to identify areas with the greatest economic impact.

Based on this analysis, interventions are made on:

  • Vehicle utilization: increasing the fill rate of vehicles reduces costs per unit transported
  • Route optimization: avoiding unnecessary or redundant routes
  • Management of extra costs: preventing unforeseen charges (waiting times, double deliveries, fuel surcharges)

Through simulations and customized reports, Makeitalia supports companies in building a more sustainable and controlled logistics model, where every euro spent is traceable and justifiable.

Package inserted into a digital logistics network for goods management and traceability

Guiding Change: Training and Operational Strategy

From Initial Mapping to Proactive Improvement Management

Logistics digitalization requires a cultural change even more than a technological one. To be truly effective, every intervention must be supported by a clear operational strategy and a targeted training program, capable of involving all relevant company functions.

Makeitalia accompanies companies starting with an initial mapping of logistics processes, useful for identifying inefficiencies, redundancies, and at-risk areas. Based on this, an intervention plan is built that balances economic objectives and operational feasibility.

In parallel, specialized training programs are activated for logistics managers, buyers, and operational teams. The objective is to provide practical tools for:

  • interpreting and using data for continuous improvement
  • effectively interacting with suppliers and logistics operators
  • managing change without internal blocks or resistance

What Makeitalia proposes is not a top-down change, but a progressive, shared, and structured process, capable of transforming digitalization into an opportunity for operational growth.

Makeitalia Alongside Companies in Logistics Transition

Operational, Concrete, and Measurable Support

Addressing logistics digitalization does not simply mean introducing new technologies, but rethinking the organizational model in an efficient, sustainable, and continuous improvement-oriented way. Makeitalia supports companies in this journey with an integrated approach, based on proven methodologies and measurable results.

Through analysis, simulation, flow reorganization, and targeted training, Makeitalia helps companies reduce costs, improve operational visibility, and increase the level of control along the supply chain.

Each project is custom-built, with concrete objectives and shared key performance indicators. The result is a guided and sustainable digital transition, capable of generating lasting benefits for the entire Supply Chain.

Contact us to discover how we can support your company in logistics digitalization and in building a more advanced and competitive operational model.

Makeitalia S.r.l. a Socio Unico
Via Jan Palach, 55 41122 Modena
VAT No: 03213690369
Company Register: MO – 368378

Makeitalia © 2026 | All Rights Reserved | Cookie Policy | Privacy Policy | Video Surveillance Privacy | Organizational Model 231